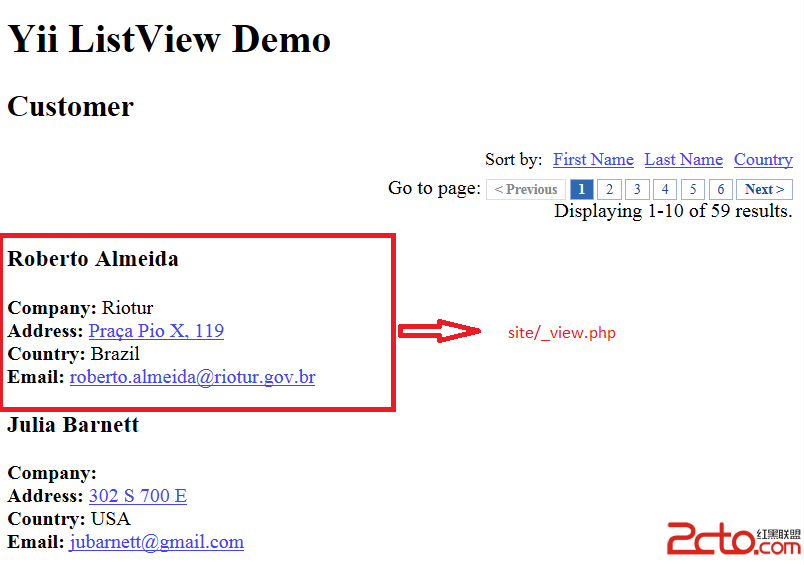
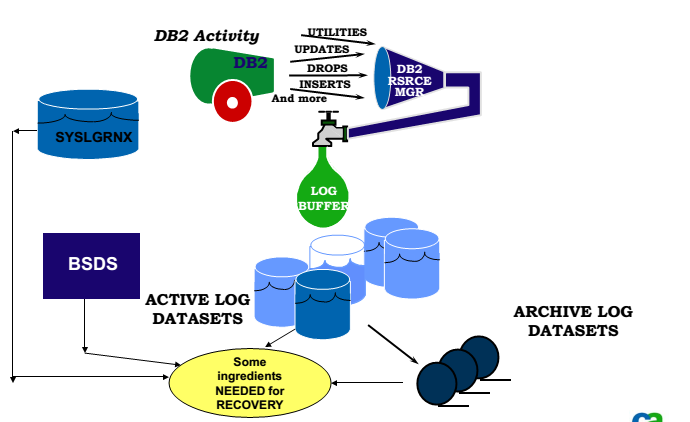
使用PHP擴展XHProf來實現函數級的性能監控。 引用官方對XHProf的描述: XHProf is a function-level hierarchical profiler for PHP and has a simple HTML based navigational interface. The raw data collection component is implemented in C (as a PHP extension). The reporting/UI layer is all in PHP. It is capable of reporting function-level inclusive and exclusive wall times, memory usage, CPU times and number of calls for each function. Additionally, it supports ability to compare two runs (hierarchical DIFF reports), or aggregate results from multiple runs. 提供函數級別的性能信息,例如調用次數,其中包括阻塞時間,內存使用情況和CPU時間。 1. 安裝與配置 /data/software # wget http://pecl.php.net/get/xhprof-0.9.2.tgz /data/software # tar zxvf xhprof-0.9.2.tgz /data/software # cd xhprof-0.9.2/ /data/software/xhprof-0.9.2 # ls -alp 總計 968 drwxr-xr-x 6 root root 4096 2013-03-18 09:09 ./ drwxr-xr-x 47 root root 8192 2013-03-18 09:09 ../ -rw-r--r-- 1 1425 users 3359 2009-06-02 01:52 CHANGELOG -rw-r--r-- 1 1425 users 266 2009-06-02 01:52 CREDITS drwxr-xr-x 2 root root 4096 2013-03-18 09:09 examples/ # demo drwxr-xr-x 8 root root 4096 2013-03-18 09:09 extension/ # pecl -rw-r--r-- 1 1425 users 10174 2009-06-02 01:52 LICENSE -rw-r--r-- 1 1425 users 186 2009-06-02 01:52 README -rw-r--r-- 1 root root 931660 2009-06-02 01:55 xhprof drwxr-xr-x 6 root root 4096 2013-03-18 09:09 xhprof_html/ # 自帶的界面包 drwxr-xr-x 4 root root 4096 2013-03-12 15:40 xhprof_lib/ # 函數庫 /data/software/xhprof-0.9.2 # cd extension/ /data/software/xhprof-0.9.2/extension # phpize /data/software/xhprof-0.9.2/extension # ./configure --with-php-config=/usr/local/services/php/bin/php-config --enable-xhprof /data/software/xhprof-0.9.2/extension # make /data/software/xhprof-0.9.2/extension # make install Installing shared extensions: /usr/local/services/php/lib/php/extensions/no-debug-non-zts-20090626/ /data/software/xhprof-0.9.2/extension # cp /usr/local/services/php/lib/php/extensions/no-debug-non-zts-20090626/xhprof.so /usr/local/services/php/extensions/ # 將生成的xhprof.so復制到extension_dir目錄下,配置php.ini,重啟php-fpm或服務器即可 // php.ini [xhprof] extension=xhprof.so xhprof.output_dir="/data/logs/servers/xhprof" # 檢查xhprof是否加載 /data/software/xhprof-0.9.2/extension # php -m|grep xhprof xhprof 2.性能分析與日志記錄 首先開啟XHProf,以便記錄十分之一的請求的性能分析日志(日志記錄在/data/logs/servers/xhprof): $xhprofEnabled = FALSE; if(extension_loaded('xhprof') && mt_rand(1, 10) === 1) { // 分析十分之一的請求性能 // 開啟性能監測 xhprof_enable(/*XHPROF_FLAGS_CPU + */XHPROF_FLAGS_MEMORY + XHPROF_FLAGS_NO_BUILTINS ); $xhprofEnabled = TRUE; } 接著注冊請求結束處理器,以便請求結束時記錄下XHProf性能分析日志: function profile_record() { if(isset($GLOBALS['xhprofEnabled']) && $GLOBALS['xhprofEnabled']) { $xhprof_data = xhprof_disable(); $path = $_SERVER['PHP_SELF']; if($pos = strpos($path, '/htdocs')) { $path = substr($path, $pos+7); } $basename = str_replace(array('.', '/'), '_', ltrim($path, '/')); /* 官方Demo,請參考下載包裡的xhprof-0.9.2/examples/sample.php * // * // Saving the XHProf run * // using the default implementation of iXHProfRuns. * // * include_once $XHPROF_ROOT . "/xhprof_lib/utils/xhprof_lib.php"; * include_once $XHPROF_ROOT . "/xhprof_lib/utils/xhprof_runs.php"; * $xhprof_runs = new XHProfRuns_Default(); */ $xhprof_runs = new HWSL_XhProfRuns(); // 記錄日志時引入時間截,方便比較不同版本間的性能差異 $run_id = $xhprof_runs->save_run($xhprof_data, 'xhprof_itravel_'.$basename.'_'.date('YmdHis')); } } register_shutdown_function('profile_record'); 生成的日志以文件保存在:xhprof.output_dir=”/data/logs/servers/xhprof” 生成的日志文件命名規則為:<run_id>.<namespace> 其中命名空間<namespace>的命名規則定義為:'xhprof_itravel_'.$basename.'_'.date('YmdHis') $basename記錄相應的文件位置,date(‘YmdHis’)記錄當前時間戳,以便比較同一文件不同版本間的性能差異。 3.日志分析 然後,通過官方提供的用戶界面包xhprof-0.9.2/xhprof_html/來查看運行報告: 要查看run_id是<run_id>和命名空間是<namespace>的報告,訪問URL: 其中各列含義如下: Inclusive Time (或子樹執行時間) :包括子樹執行時間的所有執行時間。 Exclusive Time/Self Time :函數執行本身的時間花費。不包括子樹執行時間。 Wall時間 :又名經過的時間或掛鐘時間。www.2cto.com CPU時間 : CPU時間在用戶空間+ CPU時間在內核空間。 也可以查看圖形化的性能分析報告(其中高亮顯示的路徑直觀反映了函數調用棧中最大的性能損耗路徑): 4.擴展閱讀 在生產環境中使用php性能測試工具XHProf 關於改善XHProf使用情況的設想 XHProf文件(草稿)