發現了個調試PHP源碼的好同志: PHP DEBUG TOOLS
其項目地址: http://freshmeat.net/projects/php-debug-tools/
文件下載地址: http://freshmeat.net/urls/7c58ae3fecce5763e7546b958d36e082
目前是1.03版本
這裡偶的環境是WINDOW XP , APACHE2.2, PHP5.2+ Zend Optimizer,
這裡結合PHP DEBUG TOOLS的幫助文檔來講解,圖有些是摘自文檔.
一.安裝篇
安裝前的准備環境:必須得先裝X-Debug,
至於怎樣安裝X-Debug請看http://www.xdebug.org/docs/install
1. 從http://www.xdebug.org/download.php下載合適你的X-DEBUG版本
2. 解壓DLL文件到PHP安裝目錄下的ext目錄,如C:/php/ext/php_xdebug-2.0.4-5.2.8-nts.dll
3. 修改php.ini文件,加入下段:
-------------偶是變態的分割線,你看不見我------------------------
zend_extension = "C:/php/ext/php_xdebug-2.0.4-5.2.8-nts.dll"
xdebug.collect_includes = Off
xdebug.default_enable = Off
xdebug.dump_globals = Off
xdebug.dump_once = Off
xdebug.extended_info = Off
-------------偶是變態的分割線,你看不見我------------------------
注:This example is for non-thread safe version. For the thread safe version change "zend_extension" to "zend_extension_ts"
安裝完畢,解壓PHP DEBUG TOOLS壓縮包裡的所有文件到網站發布目錄.
(假設發布目錄為c:\www,那麼就在其新建一個debug目錄,把所有文件扔進去)
在浏覽器中輸入:http://localhost/debug/test1-debug.php
如果看見下圖則安裝成功.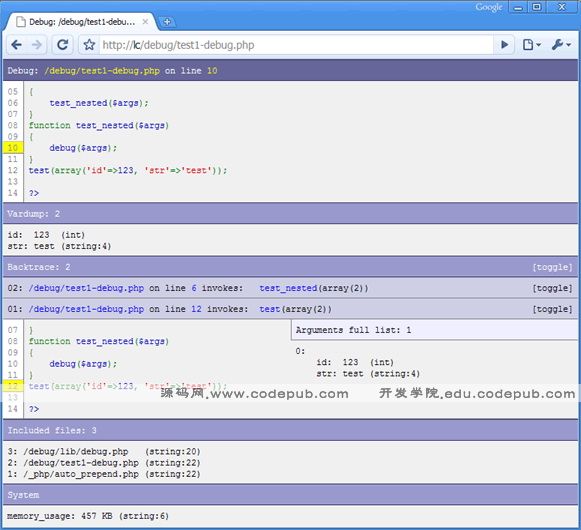
二.調試篇
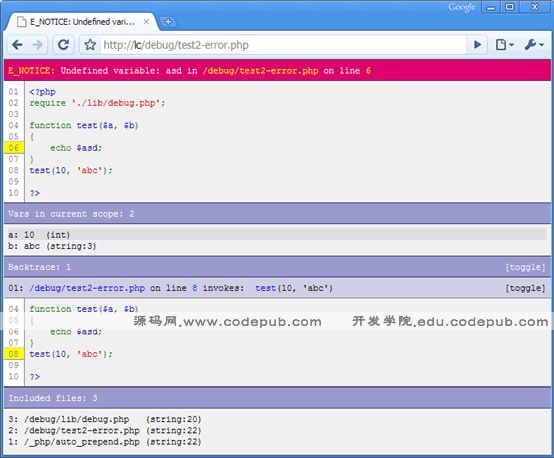
1.Debug errors
如以下代碼:
復制代碼 代碼如下:
<?php
require './lib/debug.php';
function test($a, $b)
{
echo $asd;
}
test(10, 'abc');
?> 
2.用Debug()來調試
如以下代碼:
復制代碼 代碼如下:
<?php
require './lib/debug.php';
function test($args)
{
test_nested($args);
}
function test_nested($args)
{
debug($args);
// or: debug(get_defined_vars());
// or: debug();
}
test(array('id'=>123, 'str'=>'test'));
?> 
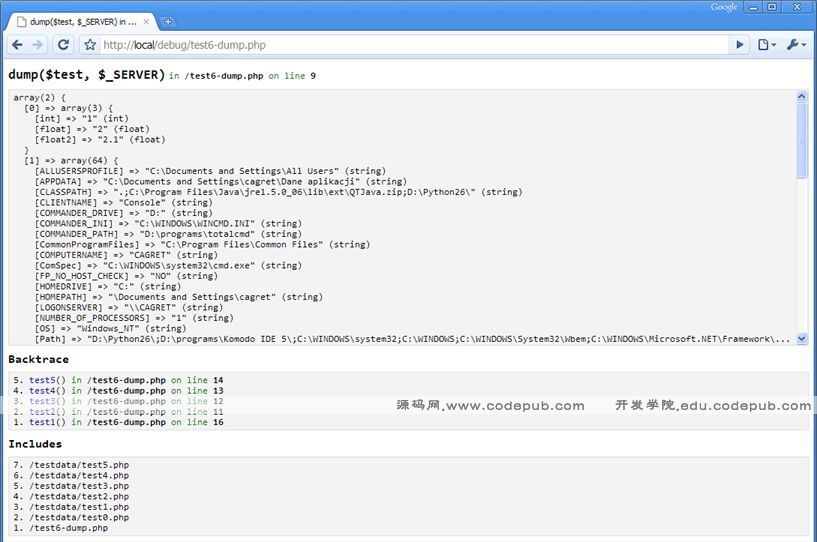
3.用dump()或者dump_tofile()調試
如以下代碼:
復制代碼 代碼如下:
<?php
include_once './lib/dump.php';
function test5()
{
include './testdata/test0.php';
$test = array('int'=>1, 'float'=>2.0, 'float2'=>2.1);
dump($test, $_SERVER);
}
function test1() { test2(); }
function test2() { test3(); }
function test3() { test4(); }
function test4() { test5(); }
test1();
?> 
至於dump_tofile()一般在以下情形使用:
A.當你不想停止程序運行時
B.不是你不想顯示調式數據,而是你不能.比如當你在AJAX請求狀態時.
C.你還想在多處地方調式
可參見debug目錄下的test7-dump_tofile.php
注:本人在運行dump()或者dump_tofile()時發現並不能出現PHP DEBUG TOOL文檔中所述 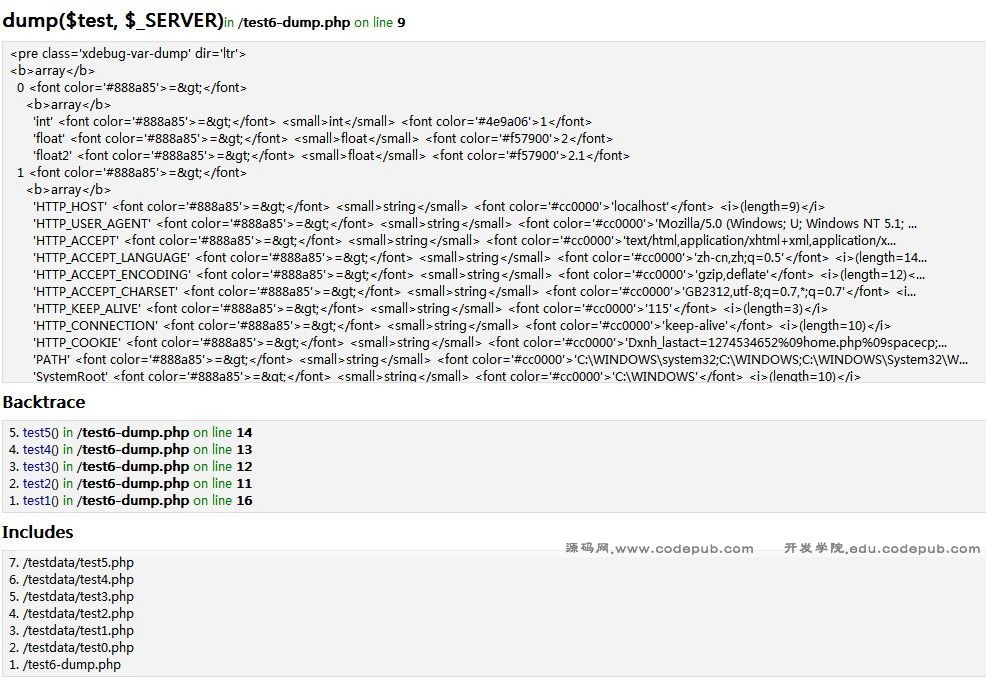
這裡可以通過修改debug/lib/debug.php的代碼來更正.(因為dump_tofile()有調用到dump(),所以我們只需修改一處.
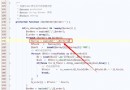
於149行處的
echo $pre;
修改成:
//edit by benben---start
echo '<script type="text/javascript">';
echo 'document.write(';
echo $pre;
echo ');';
echo '</script>';
//edit by benben---end
修正後的圖: 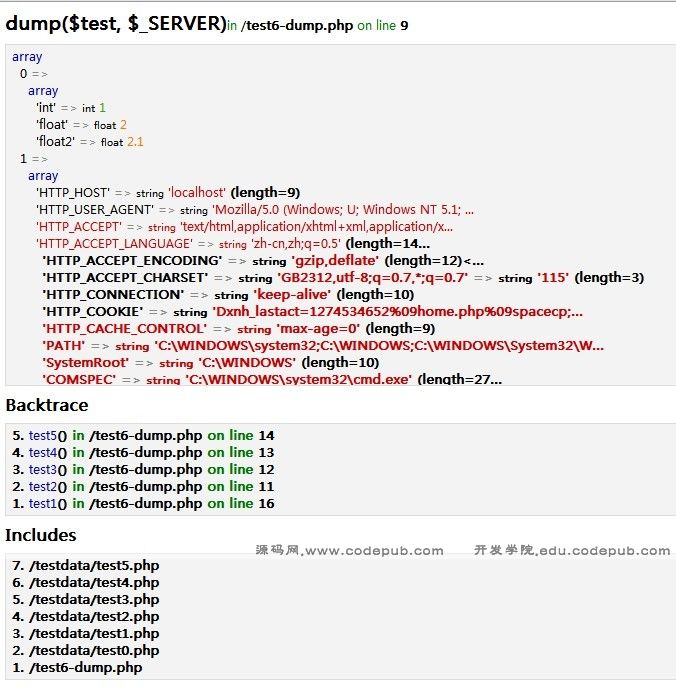
4.跟蹤代碼,查看系統性能
可以浏覽目錄下的test3-trace.php,之後點右下角的控制台就可以了.
具體可參照文檔.(文檔在壓縮包內的doc目錄下)
三,如何與項目結合?
先把php debug tool的解壓縮文件,放置於項目目錄,建個目錄就叫debug吧! : )
其實我們需要的只是幾個文件而已.
比如路徑為:c:\www\projectName\debug
之後,我們可以通過兩種方式來調試
第一種,可以在項目源碼中加入這麼一句:
include_once('./lib/debug.php');
例如以下:c:\www\projectName\hellodebug\index.php
復制代碼 代碼如下:
<?php
include_once('./debug/lib/debug.php');
$faint = 'helloworld ,debuging';
debug($arrb);
?>
什麼?你不想每個頁面都寫這麼一句?
那麼看看第二種方法,
這裡也有兩種方式,
1.修改php.ini 加入以下內容(修改成你自身的目錄):
auto_prepend_file = "c:\www\projectName\debug\auto_prepend.php"
auto_append_file = "c:\www\projectName\debug\auto_append.php"
2.修改.htaccess文件(注:此方法偶沒試過,嘿嘿)
php_value auto_prepend_file "c:\www\projectName\debug\auto_prepend.php"
php_value auto_append_file "c:\www\projectName\debug\auto_append.php"
這樣的話就可以方便整個項目的調試.
如果是AJAX開發的話,還有需要的地方,具體請參照文檔.(因本人還沒那個需要,所以暫時先跳開了,不要拍磚,嘿嘿.)