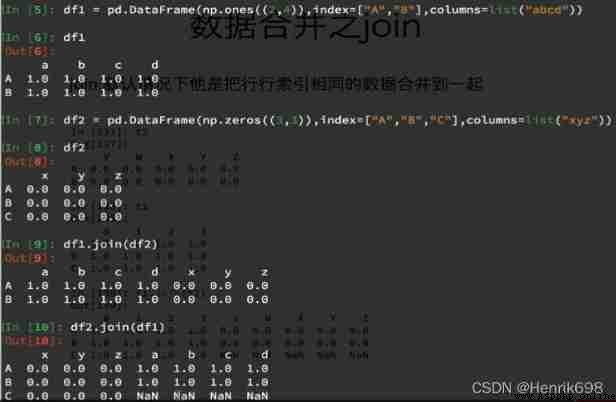
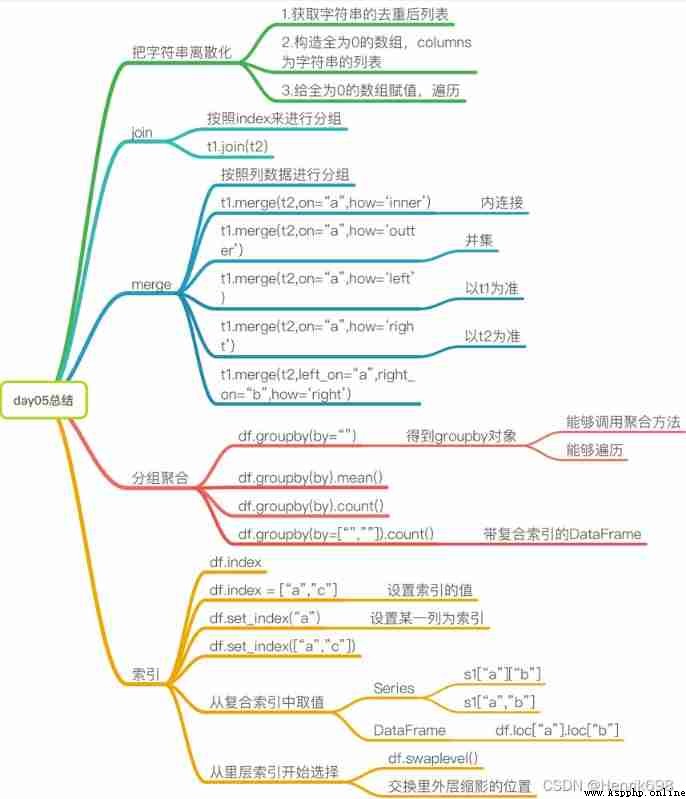
join: By default, it merges the same data in the row index 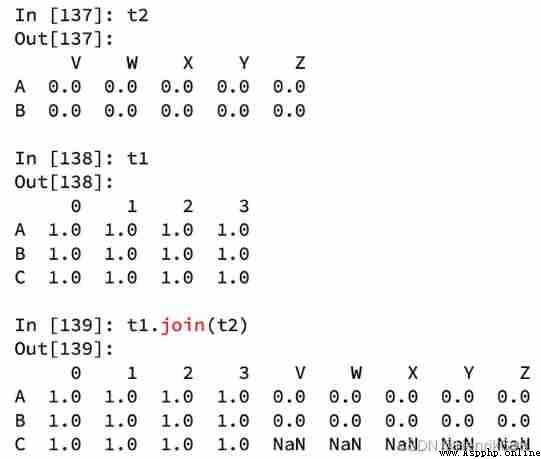
merge: Combine the data in a certain way according to the specified column 
Example :

df1 And df2 A merger ( Default inner connection inner**): Get empty DataFrame, That is, by default, the union is obtained ,df1 Is full of 1,df3 Is full of 0, The union set is empty .**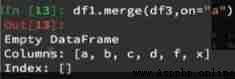
take df3 Perform a new assignment :

Proceed again df1 And df3 Merge :
If again df1 Of "A" That's ok "a" Column data assignment 100,
And merge again . The result is only one line .
If the combination method of the two is external connection outer, Take Union , The result is :
If left connection is selected , Mainly on the left :
If you select right connection , Mainly on the right :
Now we have a set of statistics about Starbucks stores around the world , If I want to know Which is more Starbucks in the United States than in China , Or I want to know The number of Starbucks in each province of China The situation of , So what to do ?
Ideas : Go through it , Every time add 1 ???
Data sources :https://www.kaggle.com/starbucks/store-locations/data
DataFrameGroupBy Objects have many optimized methods 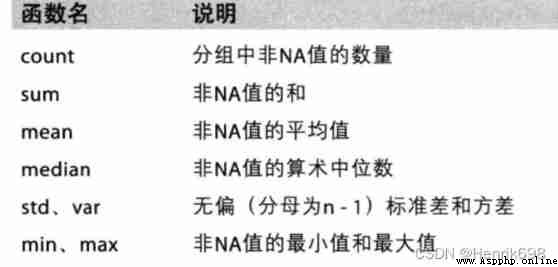
01、 There are so many Starbucks in America and China :
stay pandas We have a very simple way to complete similar grouping operations in
df.groupby(by=“columns_name”)
import numpy as np
from matplotlib import pyplot as plt
import pandas as pd
file_path= r’D:\whole_development_of_the_stack_study\RS_Algorithm_Course\ For its 1 Year of CV Course \03 machine learning - Data Science Database \14100_ machine learning - Data Science Database (HM)\ Data analysis data \day05\code\starbucks_store_worldwide.csv’
df= pd.read_csv(file_path)
#print(df.info())
#print(df.head(1))
# Countries are grouped
grouped = df.groupby(by = “Country”)
print(grouped)
#DataFrameGroupBy It can be traversed 、 Call aggregate method
## Traversal
#for i,j in grouped:
#print(‘Country:’,i)
#print("-“100)
#print(j,type(j))
#print("”*100)
## You can also select... Directly through Boolean operation
#print(df[df[“Country”]==‘ZA’])
# Call aggregate method
country_count = grouped[“Brand”].count()
print(type(country_count))
print(“US:”,country_count[“US”])
print(“CN:”,country_count[“CN”])
result :
02、 The number of Starbucks in each province of China :
# Method 1
import numpy as np
from matplotlib import pyplot as plt
import pandas as pd
file_path= r’D:\whole_development_of_the_stack_study\RS_Algorithm_Course\ For its 1 Year of CV Course \03 machine learning - Data Science Database \14100_ machine learning - Data Science Database (HM)\ Data analysis data \day05\code\starbucks_store_worldwide.csv’
df= pd.read_csv(file_path)
print(df.info())
#print(df.head(1))
# Count the number of stores in each province of China
china_data = df[df[“Country”]== “CN”]
grouped = china_data.groupby(by = “State/Province”).count()[“Brand”]
print(grouped)
# Method 2
# Data is grouped according to multiple criteria , return Series
grouped2 = df[“Brand”].groupby(by=[df[“Country”],df[“State/Province”]]).count()
print(grouped2)
print(type(grouped2))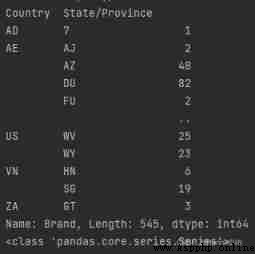
# among grouped2 The data type is Series, There are two index columns , An index is Country, The other is State/Province
# Method 3
# Let the data be grouped by multiple criteria , return DataFrame
grouped3 = df[[“Brand”]].groupby(by=[df[“Country”],df[“State/Province”]]).count()
print(grouped3)
print(type(grouped3))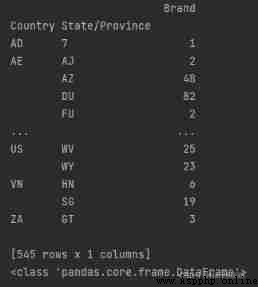
explain ,[[ ]] Two brackets , Can be Series To DataFrame type 
If we need to group countries and provinces , How to operate it ?
grouped = df.groupby(by=[df[“Country”],df[“State/Province”]])
Most of the time, we only want to get some data after grouping , Or we just want to group a few columns of data , What should we do at this time ?
Get some data after grouping :
df.groupby(by=[“Country”,“State/Province”])[“Country”].count()
Group several columns of data :
df[“Country”].groupby(by=[df[“Country”],df[“State/Province”]]).count()
Observations , Because only one column of data is selected , So the result is a Series type
If I want to return one DataFrame Type? ?
t1 = df[[“Country”]].groupby(by=[df[“Country”],df[“State/Province”]]).count()t2 = df.groupby(by=[“Country”,“State/Province”])[[“Country”]].count()
The results of the above two commands are the same
The difference from the previous result is that the current return is a DataFrame type
So here comes the question :
Compared with the previous use of a grouping condition , What are the first two columns of the current return result ? answer : Composite index
Simple index operation :
1、 obtain index:df.index:
2、 Appoint index :df.index = [‘x’,‘y’]:
3、 To reset index : df.reindex(list(“abcedf”)):
4、 Designate a column as index :df.set_index(“Country”,drop=False)
drop The default is True, That is, delete the setting as index The column of .

5、 return index The only value of :df.set_index(“Country”).index.unique()
index There is a unique() Methodical , explain index It can be repeated .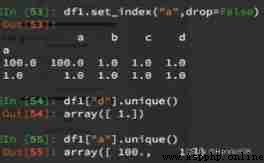

6、 hypothesis a For one DataFrame, So when a.set_index([“c”,“d”]) That is, what is the result of setting two indexes ?


Example :
a = pd.DataFrame({‘a’: range(7),‘b’: range(7, 0, -1),‘c’: [‘one’,‘one’,‘one’,‘two’,‘two’,‘two’, ‘two’],‘d’: list(“hjklmno”)})

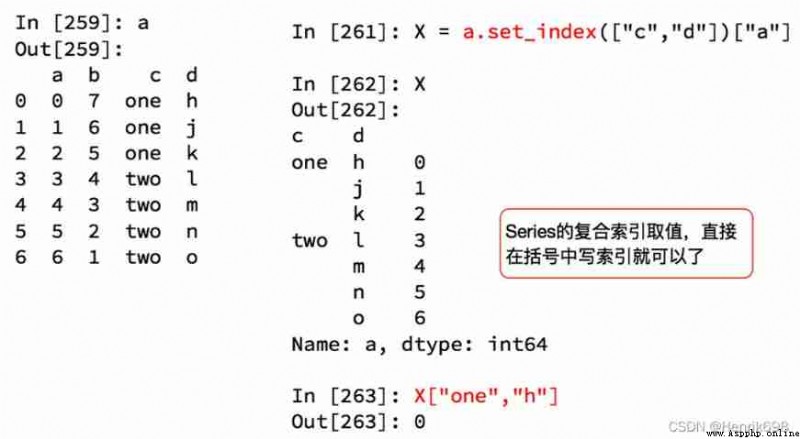
I just want to index h What about the corresponding value ?
swaplevel You can swap the order of columns that match the index , Swap inner and outer columns .

1、 Use matplotlib Show the top of the total number of stores 10 The country
import numpy as np
from matplotlib import pyplot as plt
import pandas as pd
file_path= r’D:\whole_development_of_the_stack_study\RS_Algorithm_Course\ For its 1 Year of CV Course \03 machine learning - Data Science Database \14100_ machine learning - Data Science Database (HM)\ Data analysis data \day05\code\starbucks_store_worldwide.csv’
df= pd.read_csv(file_path)
#1、 Use matplotlib Show the top of the total number of stores 10 The country
# Prepare the data
data1 = df.groupby(by=“Country”).count()[“Brand”].sort_values(ascending=False)[:10]
_x = data1.index
_y = data1.values
# drawing
plt.figure(figsize=(20,8),dpi = 80)
plt.bar(range(len(_x)),_y)
plt.xticks(range(len(_x)),_x)
plt.show()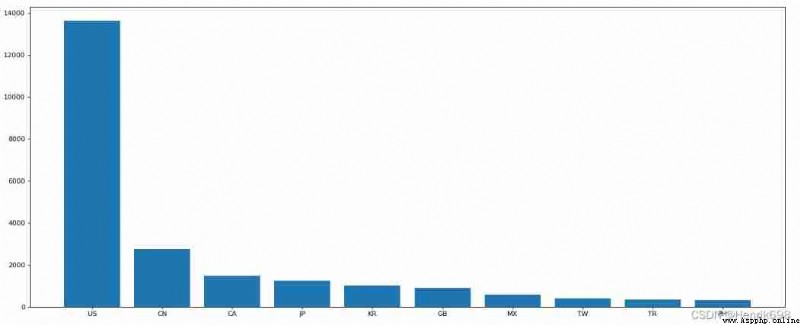
2、 Use matplotlib Show the number of stores in each city in China
import pandas as pd
# Modify the configuration dictionary at the beginning of the program rcParams, matplotlib The font used in the default configuration file of does not display Chinese correctly . In order to make the chart display Chinese correctly , There are several solutions .
from pylab import *
mpl.rcParams[‘font.sans-serif’] = [‘SimHei’] # Specify default font
mpl.rcParams[‘axes.unicode_minus’] = False # Resolve save image is negative ’-' Questions displayed as squares
file_path= r’D:\whole_development_of_the_stack_study\RS_Algorithm_Course\ For its 1 Year of CV Course \03 machine learning - Data Science Database \14100_ machine learning - Data Science Database (HM)\ Data analysis data \day05\code\starbucks_store_worldwide.csv’
df= pd.read_csv(file_path)
df= df[df[“Country”]==‘CN’]
print(df.head(1))
#1、 Use matplotlib Show the top of the total number of stores 10 The country
# Prepare the data
data1 = df.groupby(by=“City”).count()[“Brand”].sort_values(ascending=False)[:25]
_x = data1.index
_y = data1.values
# drawing
plt.figure(figsize=(20,8),dpi = 80)
#plt.bar(range(len(_x)),_y,width=0.3,color=“orange”)
plt.barh(range(len(_x)),_y,height=0.3,color=“orange”)
#plt.xticks(range(len(_x)),_x)
plt.yticks(range(len(_x)),_x)
plt.show()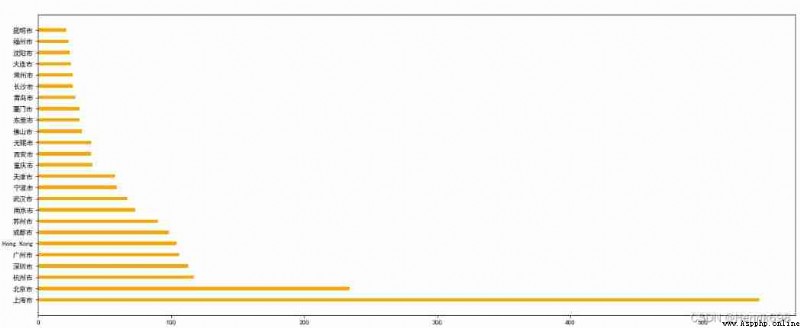
3、 Now we have the top in the world 10000 Data in this book , Then please count the following questions :
01. Number of books in different years
02. Average score of books in different years
Receipt source :https://www.kaggle.com/zygmunt/goodbooks-10k
import numpy as np
from matplotlib import pyplot as plt
import pandas as pd
# Modify the configuration dictionary at the beginning of the program rcParams, matplotlib The font used in the default configuration file of does not display Chinese correctly . In order to make the chart display Chinese correctly , There are several solutions .
from pylab import *
mpl.rcParams[‘font.sans-serif’] = [‘SimHei’] # Specify default font
mpl.rcParams[‘axes.unicode_minus’] = False # Resolve save image is negative ’-' Questions displayed as squares
file_path= r’D:\whole_development_of_the_stack_study\RS_Algorithm_Course\ For its 1 Year of CV Course \03 machine learning - Data Science Database \14100_ machine learning - Data Science Database (HM)\ Data analysis data \day05\code\books.csv’
df= pd.read_csv(file_path)
# Number of books in different years
#print(df.head(2))
#print(df.info())
# The year after checking is missing
# Get the year without missing rows
#data1 = df[pd.notnull(df[“original_publication_year”])]
#grouped = data1.groupby(by= “original_publication_year”).count()[“title”]
#print(grouped)
# Average score of books in different years
# Get the year without missing rows
data1 = df[pd.notnull(df[“original_publication_year”])]
grouped=data1[“average_rating”].groupby(by=data1[“original_publication_year”]).mean()
#print(grouped)
# drawing
_x=grouped.index
_y=grouped.values
plt.figure(figsize=(20,8),dpi = 80)
plt.plot(range(len(_x)),_y)
print(len(_x))
plt.xticks(list(range(len(_x)))[::10],_x[::10].astype(int),rotation=45)
plt.show()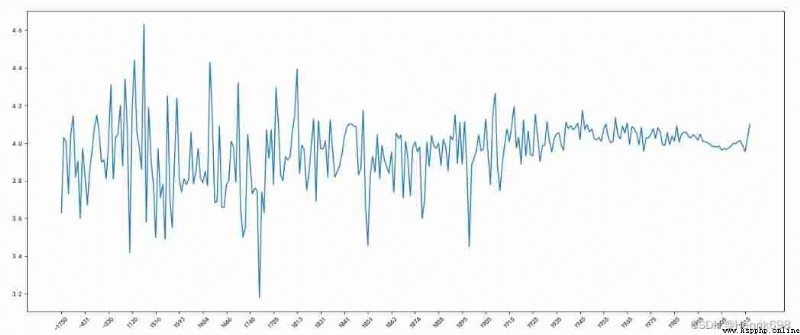
 Let the python fly: image understanding python lists and tuples, dictionary, collection, operator
Day03 Eight quit war descended
 Pythongui based drawing tool software design course paper + operation manual + demonstration video + source code and data files
Resource download address :htt