參考書目:《深入淺出Pandas:利用Python進行數據處理與分析》
pandasIt is convenient to do simple descriptive statistics,Calculate various simple statistics,平均值,方差,The median or something can usually be solved in a day or two with an order.
import pandas as pd
import numpy as np
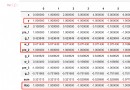
df = pd.read_excel('https://www.gairuo.com/file/data/team.xlsx')
s = df.Q1 # 取其中一列,形成 Series
df.head() # View the first five pieces of datadf.head(10) # 查看前10條數據
df.tail() # 查看後五條數據
df.tail(10) # 查看後10條數據
df.sample() # 隨機查看一條數據
df.sample(3) # 隨機查看3條數據
df.sample(10, random_state=0).reset_index(drop=True) # Reset index after randomdf.shape # (100, 6),共 100 行,6列 (索引不算)
s.shape # (100,) Series 只有一個值
df.info() ##基本信息
df.dtypes ##數據類型,如果是 Series 需要用 s.dtype
df.axes ## Row and column index content df.axesdf.index # RangeIndex(start=0, stop=100, step=1)
df.columns # 列索引,Series 不支持
df.values # 建議使用 to_numpy()
df.to_numpy() # numpy array(<所有值的列表矩陣>)
df.ndim # 2 維度數
df.size # 600 行x列的總數,is how much data there is in total
# 是否為空,注意有空值不認為是空
df.empty # False
dfs.keys() # Series 的索引, DataFrame 的列名
df.first_valid_index() # 0 # 返回第一個非NA/空值的索引
df.last_valid_index() # 99 # Return the last notNA/空值的索引df.flags # Tag information for the data(Currently only supports whether to repeat tags)pd 1.2.0+
# <Flags(allows_duplicate_labels=True)>
df.attrs={'info': '學生成績表'} # 設置元信息,Can be used for data foundation information description
df.attrs # # 查看元信息 {'info': '學生成績表'}
# Whether labels are allowed to be duplicated
df.flags["allows_duplicate_labels"]
df.flags.allows_duplicate_labels # True
df.set_flags(allows_duplicate_labels=False) # 設置##Series The unique ones are as follows
s.name # 'Q1'
s.array # 值組成的數組 <PandasArray>
s.dtype # 類型,dtype('int64')
s.hasnans # False 是否有空df.describe()pd.Series(['a', 'b', 'c', 'c']).describe()
s2 = pd.Series([np.datetime64("2000-01-01"),np.datetime64("2010-01-01"),
np.datetime64("2010-02-01")])
s2.describe(datetime_is_numeric=True)df.describe(percentiles=[.05, .25, .75, .95])#指定分位數
df.describe(include=[np.object, np.number]) # 指定類型
df.describe(exclude =[np.object]) # 排除類型df.mean()#生成series,Average per column
df.mean(1)# Average per row
df.mean(axis=1)# Average per row
df.mean(axis='columns')# Average per row
df.Q1.mean()#指定列
df.set_index('name').mean(1).head()df.mean() # 返回所有列的均值
df.mean(1) # 返回所有行的均值,下同
df.corr() # 返回列與列之間的相關系數
df.count() # 返回每一列中的非空值的個數
df.max() # 返回每一列的最大值
df.min() # 返回每一列的最小值
df.abs() # 絕對值
df.median() # 返回每一列的中位數
df.std() # 返回每一列的標准差, 貝塞爾校正的樣本標准偏差
df.var() # 無偏方差
df.sem() # 平均值的標准誤差
df.mode() # 眾數
df.prod() # 連乘
df.mad() # 平均絕對偏差
df.cumprod() # 累積連乘,累乘
df.cumsum(axis=0) # 累積連加,累加
df.nunique() # 去重數量,不同值的量
df.idxmax() # 每列最大的值的索引名
df.idxmin() # 最小
df.cummax() # 累積最大值
df.cummin() # 累積最小值
df.skew() # 樣本偏度 (第三階)
df.kurt() # 樣本峰度 (第四階)
df.quantile() # 樣本分位數 (不同 % 的值)###其他
# Many support specifying ranks(默認是 axis=0 列)等參數
df.mean(1) # 按行計算
# 很多支持
df.sum(0, skipna=False) # Whether to exclude missing data
# 很多支持
df.sum(level='blooded') # 索引級別
df.sum(level=0)
df.sum(min_count=1)# The minimum significant value required to perform an addition operation
df.sum(1, numeric_only=True)# 按行計算,Only numeric types are evaluated
# Customizable correlation function
def histogram_intersection(a, b):
v = np.minimum(a, b).sum().round(decimals=1)
return v
df = pd.DataFrame([(.2, .3), (.0, .6), (.6, .0), (.2, .1)],columns=['dogs', 'cats'])
df.corr(method=histogram_intersection)df.all() # 返回所有列all()值的Series
df.any()
# Evaluate generated columns with expressions.Only columns are supported,Not too safe
biaodashi='總成績='+'+'.join(df.columns[2:])
biaodashi2='平均成績=('+'+'.join(df.columns[2:])+')/3'
df.eval(biaodashi) #inplace=True,Indicates modification on the original dataset,生成新列
df.eval(biaodashi2,inplace=True) #inplace=True,Indicates modification on the original dataset,生成新列# 四捨五入
df.round(2) # 指定字段指定保留小數位,如有
df.round({'Q1': 2, 'Q2': 0})
df.round(-1) # 保留10位
# 每個列的去重值的數量
df.nunique()
s.nunique() # 本列的去重值
# Authenticity detection
df.isna() # True and false value substitution for the value
df.notna() # 與上相反df + 1 # 等運算
df.add() # 加
df.sub() # 減
df.mul() # 乘
df.div() # 除
df.divmod() # 返回 (a // b, a % b)
df.truediv() # Divide DataFrames (float division).
df.floordiv() # Divide DataFrames (integer division).
df.mod() # 模,除後的余數
df.pow() # 指數冪
df.dot(df2) # 矩陣運算# Unique values and quantities
s.value_counts()
s.value_counts(normalize=True) # Frequency of repeating values
s.value_counts(normalize=True)*100 # The percentage of the current value in the series
s.value_counts(sort=False) # Not sorted by frequency
s.unique() # 去重的值 array
s.is_unique # 是否有重復
# 最大最小值
s.nlargest() # 最大的前5個
s.nlargest(15) # 最大的前15個
s.nsmallest() # 最小的前5個
s.nsmallest(15) # 最小的前15個
s.pct_change() # Calculates the percent change from the previous row
s.pct_change(periods=2) # 前兩行
s1.cov(s2) # Covariance of two seriesdf['Q1'].squeeze()
# 單值 DataFrame 和 Series Convert to scalar
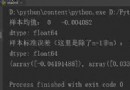
df.iloc[0, 2].squeeze() # 36
df.loc[df.index==5, ['name']].squeeze() # 'Harlie'