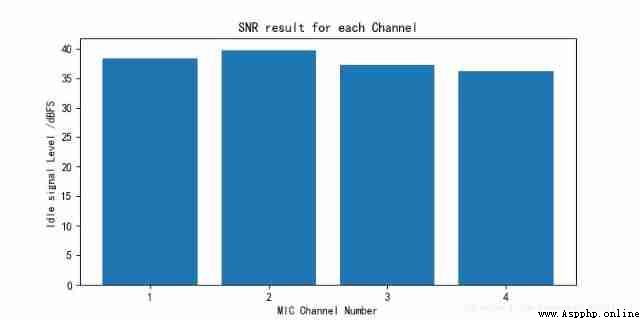
In the use of python When processing audio signals , Use plt.plot When plotting histogram , You want the abscissa to be an integer , I.e. audio channel number , The method commonly used is :
xticksig = np.arange(1,1+MicNum)Or add a step to it :
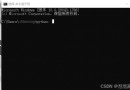
xticksig = np.arange(1,1+MicNum,1)However, the abscissa obtained by these two methods has decimals , As shown in the figure below :

The correct usage should be as follows :
xticksig = np.arange(1,1+MicNum).astype(dtype=np.str) The results are shown in the figure below , Abscissa has no decimals , Only integer :