6 Month is graduation season , College entrance examination students are preparing to fill in the volunteers . This article uses Python It shows the distribution of colleges and universities across the country , There are many colleges and universities in China , Which places are less , You can see at a glance .
Data acquisition
To show the distribution of colleges and universities , You have to get the location data of colleges and universities nationwide first . The data of this article comes from the handheld college entrance examination network (https://www.gaokao.cn/school/search).
stay 2022 year 6 When writing this article last month , A total of 2822 Information about colleges and universities . Checked the data , Except for a few null values , The whole data is very complete , Not affecting use . The data is 44 A field , This article will only use a few fields , You can do nothing about it , When using, you can get it on demand .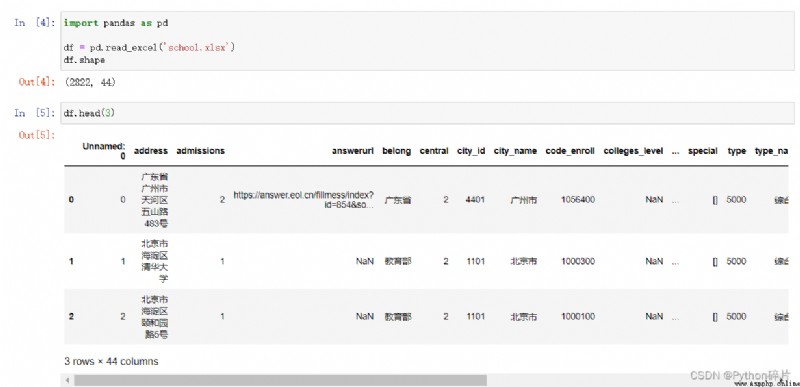
Introduction to data acquisition methods ( Basic reptile knowledge ):
1. Register and log in to the handheld college entrance examination website . stay < Check the school > Select all schools on the page .
2. Press F12 key , Click to Network > Fetch/XHR, And then click a few times < Check the school > Page < The previous page >、< The next page > Button , stay XHR The page of will show the visited API Etc .
3. Turn the page every time API Copy it out for comparison , It is found that there are two parameters that change when turning pages :page and signsafe,page Is the number of pages currently accessed ,signsafe It's a md5 value , There is no reverse solution , But you can save the previous values , Later random change use . With this information , Constantly changing the number of pages visited and signsafe value , You can get all the school data .
Response Medium numFound The parameter value is the total number of schools , Divide by the number of schools displayed on each page to get the total number of pages , You can also directly click on the page < Tail page > View total pages , This determines the number of visits .
4. Because the website needs to be logged in to use , So we need to get the information of the access Headers, Such as Request Method( This time POST)、User-Agent etc. .
5. With the information above , Loop and splice all pages url, use requests Send a request to get the data of all colleges and universities , And then use pandas Write data to excel in .
reminder : Access to data is subject to the relevant statements of the website , Try to set a certain time interval for the crawler code , Do not run crawler code during peak access periods .
Additional explanation :
People's daily. Com recently announced : The number of colleges and universities in China is 2759 the , And this article obtained from the handheld college entrance examination network 2822 Difference 63 the , It is mainly the difference caused by different statistical methods of branch schools of some schools . This article shows the distribution , The difference has little effect .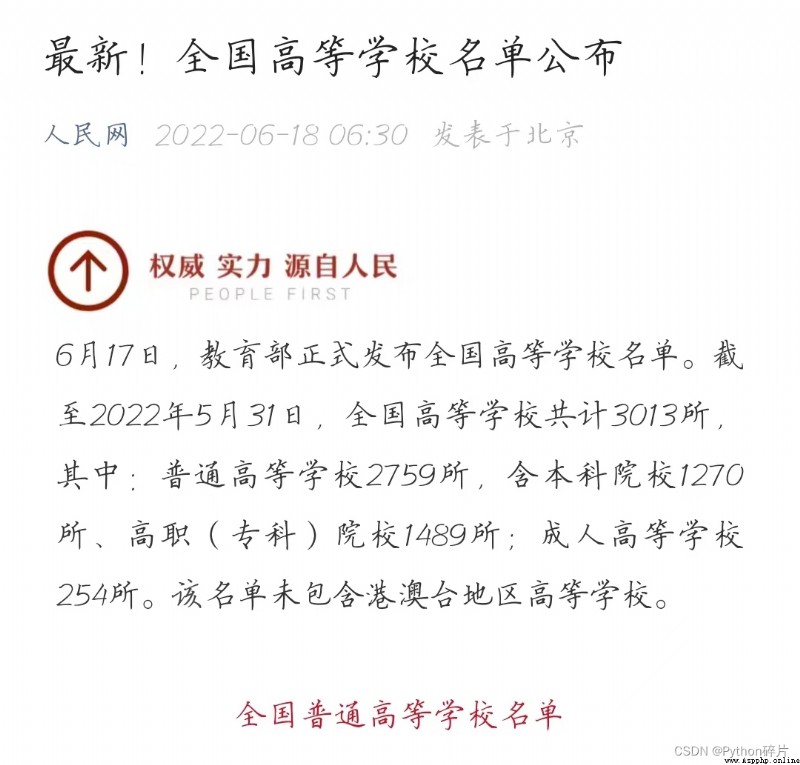
Latitude and longitude acquisition
The handhold college entrance examination website is a website that provides volunteer services for college entrance examination , Although the data obtained are 44 A field , But there is no longitude and latitude of the school . In order to better display the location of colleges and universities on the map , You need to obtain the corresponding longitude and latitude according to the address of the school .
This article uses Baidu map open platform :https://lbsyun.baidu.com/apiconsole/center#/home, You can use the open interface of Baidu map to obtain the longitude and latitude of the geographical location .
The procedure is :
1. Register and log in baidu account , This account can be a common account for the whole Baidu ecosystem ( Such as network disk 、 The account number of the library is universal ).
2. Log in to Baidu map open platform , Click to enter < Console >, And then in < Application management > Click on the < My application >, Click again < Create an > Create an application . Apply name customization , Other information shall be completed according to the prompts and requirements , And real name authentication , Become an individual developer .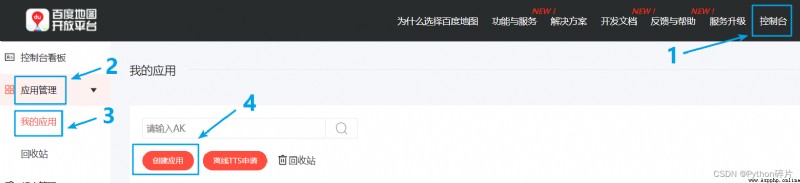
3. After creating the app , Will get an application < To access the application (AK)>, Use this AK Value can call Baidu's API, The reference codes are as follows .
import requests
def baidu_api(addr):
url = "http://api.map.baidu.com/geocoding/v3/?"
params = {

"address": addr,
"output": "json",
"ak": " Copy the app you created AK Here we are "
}
req = requests.get(url, params)
res = req.json()
if len(res["result"]) > 0:
loc = res["result"]["location"]
# print(loc)
return loc
else:
print(" obtain {} Longitude and latitude failed ".format(addr))
return {
'lng': '', 'lat': ''}
4. Successfully called Baidu map API after , Read the location of all colleges , Call the above functions in turn , Get the longitude and latitude of all colleges , To write excel in .
import pandas as pd
import numpy as np
def get_lng_lat():
df = pd.read_excel('school.xlsx')
lng_lat = []
for row_index, row_data in df.iterrows():
addr = row_data['address']
if addr is np.nan:
addr = row_data['city_name'] + row_data['county_name']
# print(addr)
loc = baidu_api(addr.split(',')[0])
lng_lat.append(loc)
df[' Longitude and latitude '] = lng_lat
df[' longitude '] = df[' Longitude and latitude '].apply(lambda x: x['lng'])
df[' latitude '] = df[' Longitude and latitude '].apply(lambda x: x['lat'])
df.to_excel('school_lng_lat.xlsx')
The final data results are shown in the figure below :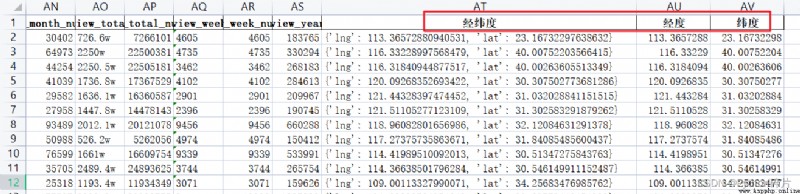
Individual developers should pay attention to when using Baidu map open platform , There is a daily limit , So don't use all the data when debugging the code , First use demo Run through , Otherwise, you have to wait one day or buy the quota .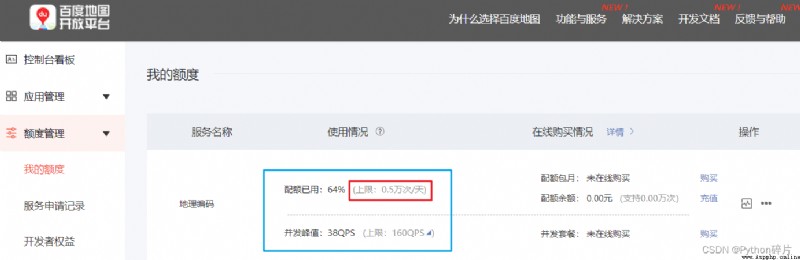
University location display
The data is ready , Then show them on the map .
This article uses Baidu open source data visualization tool Echarts,Echarts by Python Language provides pyecharts library , Easy to use .
Installation command :
pip install pyecharts
1. Mark the location of the University
from pyecharts.charts import Geo
from pyecharts import options as opts
from pyecharts.globals import GeoType
import pandas as pd
def multi_location_mark():
""" Mark points in batch """
geo = Geo(init_opts=opts.InitOpts(bg_color='black', width='1600px', height='900px'))
df = pd.read_excel('school_lng_lat.xlsx')
for row_index, row_data in df.iterrows():
geo.add_coordinate(row_data['name'], row_data[' longitude '], row_data[' latitude '])
data_pair = [(name, 2) for name in df['name']]
geo.add_schema(
maptype='china', is_roam=True, itemstyle_opts=opts.ItemStyleOpts(color='#323c48', border_color='#408080')
).add(
'', data_pair=data_pair, type_=GeoType.SCATTER, symbol='pin', symbol_size=16, color='#CC3300'
).set_series_opts(
label_opts=opts.LabelOpts(is_show=False)
).set_global_opts(
title_opts=opts.TitleOpts(title=' National University location map ', pos_left='650', pos_top='20',
title_textstyle_opts=opts.TextStyleOpts(color='white', font_size=16))
).render('high_school_mark.html')
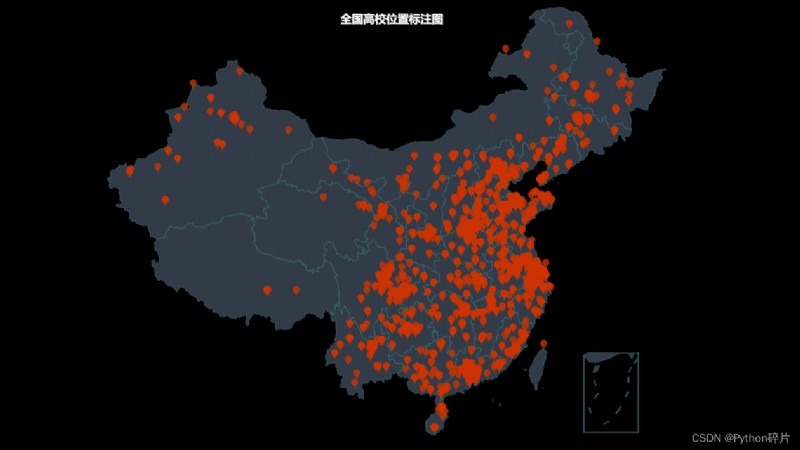
From the result of annotation , Colleges and universities are mainly distributed along the coast 、 Central and Eastern , In the west, especially in high altitude areas, the distribution is relatively small .
2. Draw the heat map of colleges and universities
from pyecharts.charts import Geo
from pyecharts import options as opts
from pyecharts.globals import ChartType
import pandas as pd
def draw_location_heatmap():
""" Draw a heat map """
geo = Geo(init_opts=opts.InitOpts(bg_color='black', width='1600px', height='900px'))
df = pd.read_excel('school_lng_lat.xlsx')
for row_index, row_data in df.iterrows():
geo.add_coordinate(row_data['name'], row_data[' longitude '], row_data[' latitude '])
data_pair = [(name, 2) for name in df['name']]
geo.add_schema(
maptype='china', is_roam=True, itemstyle_opts=opts.ItemStyleOpts(color='#323c48', border_color='#408080')
).add(
'', data_pair=data_pair, type_=ChartType.HEATMAP
).set_series_opts(
label_opts=opts.LabelOpts(is_show=False)
).set_global_opts(
title_opts=opts.TitleOpts(title=' Nationwide University distribution heat map ', pos_left='650', pos_top='20',
title_textstyle_opts=opts.TextStyleOpts(color='white', font_size=16)),
visualmap_opts=opts.VisualMapOpts()
).render('high_school_heatmap.html')
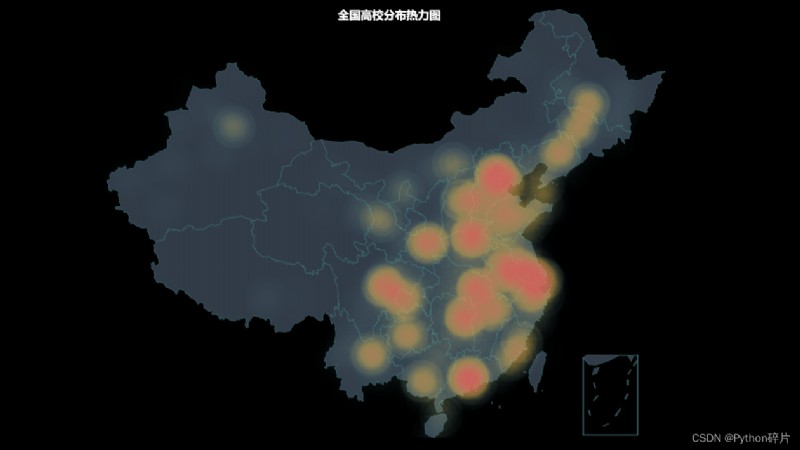
From the thermodynamic diagram , The places where colleges and universities are concentrated are mainly along the coast 、 Beishangguang 、 The Yangtze and yellow river basins , Sichuan and Chongqing are the only places in the West .
3. Draw the distribution density map by province
from pyecharts.charts import Map
from pyecharts import options as opts
import pandas as pd
def draw_location_density_map():
""" Draw the distribution density map of colleges and universities in each province """
map = Map(init_opts=opts.InitOpts(bg_color='black', width='1200px', height='700px'))
df = pd.read_excel('school_lng_lat.xlsx')
s = df['province_name'].value_counts()
data_pair = [[province, int(s[province])] for province in s.index]
map.add(
'', data_pair=data_pair, maptype="china"
).set_global_opts(
title_opts=opts.TitleOpts(title=' The distribution density of colleges and universities across the country by province ', pos_left='500', pos_top='70',
title_textstyle_opts=opts.TextStyleOpts(color='white', font_size=16)),
visualmap_opts=opts.VisualMapOpts(max_=200, is_piecewise=True, pos_left='100', pos_bottom='100', textstyle_opts=opts.TextStyleOpts(color='white', font_size=16))
).render("high_school_density.html")

It can be seen from the provincial distribution density map , The provinces with a large number of colleges and universities are concentrated in the central and eastern regions , Especially in the provinces near Beijing and Shanghai .
4.211 and 985 The distribution of colleges and universities
select 211 and 985 College data of , Draw again .( The code is not pasted repeatedly , Just add a line of filter code )
The above is the whole content of this paper , If you are interested in the above , You can try more , You can also contact the blogger to discuss .
Reference documents :
1. Handhold college entrance examination network :https://www.gaokao.cn/school/search
2.pyecharts Chinese document :https://pyecharts.org/#/zh-cn/geography_charts
 According to the longitude and latitude coordinates, the name of the administrative division city of the province, city and county is obtained, and the self built database Java Python PHP C # Net
Catalog Step one 、 Download p