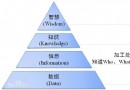
In the design process of the dashboard You need to summarize the most important KPI Or indicators , In order to provide you with complete process information or description . Generally speaking , These indicators have remained unchanged ( Or at least that's the goal ). Generally speaking , Most dashboard layouts and information are static .
But sometimes the indicators or series used in the dashboard need to be changed at any time . This is the case with economic and financial time series . Economic and financial time series are often related , But over time , There is a lag between them , And there is no way to know exactly what the lag order is , Or what time series will show you the next piece of information you need to make a decision .
The solution to this situation is to let the user create a new dashboard layout , Add a new time series to the dashboard and save the results . In this short article , I want to show you how to use Python Operate the panel . This is not a step-by-step tutorial . I'll just show you some of the features implemented in the dashboard , In the last section, I'll provide you with GitHub link .
According to the official website https://panel.holoviz.org
Panel It's open source Python library , Allows you to connect user-defined widgets to drawings by 、 Images 、 Form or text to create custom interactive Web Applications and dashboards .
Use the panel , You don't need to know how to Javascript Created in HTML Component and its interaction , Because you use all Python Encoding .
The dashboard integrates different data sources (API) To visualize .
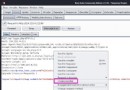
This article explains the main functions of the dashboard through some code , But if you want to use it , Download the code for the repository and follow README.md The instructions contained in the file .
The dashboard will have the following layout . The dashboard is simple , You can add new analysis tabs and plot Series in each tab .