The population data is json Format file , So you need to use json Modules to handle them
Pygal Provides a map creation tool suitable for beginners , You can use it to visualize population data , To explore the distribution of the global population .
(1) Import python Bring your own world map package and country code package
# Import world map package (python Bring your own world map pack )
import pygal.maps.world
# Import package with country code COUNTRIES Is a dictionary type of data information ,key Country alias ,value The value is the country name
from pygal_maps_world.i18n import COUNTRIES
(2) Download the world population dataset and view information about the data
filename="D:\python_test1\population_data.json"
with open(filename)as f:
# utilize json Module read file json.load()
#pop_data json Type object
pop_data=json.load(f)
print(pop_data)
#'Country Code': 'MEA', 'Year': '2000', 'Value': '312596988.293994'}, {'Country Name': 'Middle East & North Africa (all income levels)', 'Country Code': 'MEA', 'Year': '2001', 'Value': '318759417.157542'}, {'Country Name': 'Middle East & North Africa (all income levels)', 'Country Code': 'MEA', 'Year': '2002', 'Value': '325087018.594954'},......
【 Key points 】:
complete json Format file related operations
(1)json.dumps() take Python The object is encoded as JSON character string ==> write in
(2)json.loads() Will have been encoded JSON The string is decoded to Python object (Json object ) ==> Read
(3) Create a function , According to the country name , Find the corresponding country code
# Create a function , Used to obtain the country code Find the country code through the function , Improve code utilization
def get_country_code(country_name):
# According to the designated country name , return Pygal The two letter country code used
for code,name in COUNTRIES.items():
if name==country_name:# If you find the desired value
return code
# If not found , Then return to none
return None
(4) Visual instance —— draw 2010 World population map
def show_populationmap():
filename="D:\python_test1\population_data.json"
with open(filename)as f:
# utilize json Module read file json.load()
#pop_data json Type object
# Read json file ( Multiple key value pairs )
pop_data=json.load(f)
# Create a complete world population map
# Create a dictionary that contains the number of people
cc_population={
}
""" Working with datasets , Get the data you need """
for pop_dict in pop_data:
if pop_dict['Year'] == '2010':
country_name = pop_dict['Country Name']
# String the population number as Convert to integer type Transformation takes two steps
population = int(float(pop_dict['Value']))
# 【 Be careful 】: The format of raw data is often inconsistent , Therefore, mistakes often occur , For example, a string containing a decimal point cannot be directly typed into int type .
# 【 Solution 】: First convert the string to a floating point number , Then convert the floating-point number to an integer ( Transformation takes two steps ).
# function float() Convert a string to a decimal , The function int() Discard the fraction , Returns an integer .
# Get Country alias ( Call the prepared function )
code=get_country_code(country_name)
# Dictionary is another variable container model , Colon each key value pair (:) Division , Comma between each key value pair (,) Division , The whole dictionary consists of curly brackets {} Surround ;
# The keys in a dictionary are usually unique , If it is repeated, the following key value pair will overwrite the previous one , However, dictionary values do not need to be unique ;
# The value can take any data type , But the key must be immutable , Like strings , A number or tuple , But it can't be a list because the list is variable .
if code :# If the country code is not empty Add key value pairs to the dictionary
cc_population[code]=population
""" Visual drawing """
# Map the world's population
# newly build Worldmap example (python Bring your own atlas )
wm=pygal.maps.world.World()
wm.title="World Population in 2010, by Country"
#add() Method accepts a tag and a list , The list contains the country code of the country to be highlighted
# Every time you execute add() Will choose a new color for the designated country , The color and the assigned label are displayed on the left side of the chart
# wm.add('North America', ['ca', 'mx', 'us'])
# wm.add('Central America', ['bz', 'cr', 'gt', 'hn', 'ni', 'pa', 'sv'])
# Add the number of people to the corresponding country
#add() Method accepts a tag and a dictionary , The dictionary takes the country code as the key , Population is a value ,Pygal According to these figures, different countries are automatically colored in different shades , Generally, the quantity is large , It's darker
wm.add('2010',cc_population)#cc_population Dictionary type
# Save as svg Format vector diagram
wm.render_to_file('D:\python_test1\ americas.svg')
【 Result display 】
【 Key points 】:
(1) Reduce the accuracy of data with high accuracy
String the population number as Convert to integer type Transformation takes two steps
population = int(float(pop_dict[‘Value’]))
As a result of json Read file contents in file , The type is character type , For data processing or visualization , You need to convert the data into numerical data
for example :‘312596988.293994’ This value has a high precision , When visualizing , Just integer data , But converting such high-precision data directly into integers , There are always mistakes
【 Problem description 】: The format of raw data is often inconsistent , Therefore, mistakes often occur , For example, a string containing a decimal point cannot be directly typed into int type
【 Solution 】: Usually used , First convert it to a floating-point number type , And then convert to integer ( Two steps )
(2) call python Its own map model
We just need to go through add() function , Add your own actual data for the map , Set related properties , Add your own elements
# New instance
wm=pygal.maps.world.World()
(3)add() function
Grammar 1 、 Receive a tag and a list
The list contains the contents to be highlighted ( For example, the Country alias of the country to be highlighted in this case )
# Every time you execute add() Will choose a new color for the designated country , The color and the assigned label are displayed on the left side of the chart
for example :
wm.add('North America', ['ca', 'mx', 'us'])
wm.add('Central America', ['bz', 'cr', 'gt', 'hn', 'ni', 'pa', 'sv'])
wm.add('South America', ['ar', 'bo', 'br', 'cl', 'co', 'ec', 'gf', 'gy', 'pe', 'py', 'sr', 'uy', 've'])
Grammar II 、 Receive a tag and a dictionary
For example, in this case , The dictionary takes the country code as the key , Population is a value ,Pygal According to these figures, different countries are automatically colored in different shades
for example :
wm.add('North America', {
'ca':34126000, 'mx':309349000, 'us':113423000})
(5) premium 1.0—— Group countries according to their population
def show_populationmap():
""" The grammar and logic are consistent """
# Group by population , Will be divided into 3 Group
level1,level2,level3={
},{
},{
}
for pop_dict in pop_data:
if pop_dict['Year'] == '2010':
country_name = pop_dict['Country Name']
# String the population number as Convert to integer type Transformation takes two steps
population = int(float(pop_dict['Value']))
# Get Country alias
code = get_country_code(country_name)
if population>1000000000:# The population is larger than 10 Billion
if code: # If the country code is not empty
level1[code] = population
elif population>=10000000: # The population is larger than 1 Billion
if code:
level2[code] = population
else:
if code:
level3[code] = population
# Create a map instance
new_wm=pygal.maps.world.World()
new_wm.title="World Population in 2010, by Country"
new_wm.add("above 100000000",level1)
new_wm.add("between 10000000 and 100000000", level2)
new_wm.add("below 10000000", level3)
# Save as svg Format file
new_wm.render_to_file('D:\python_test1\ new_worlds_pop.svg')
【 Result display 】: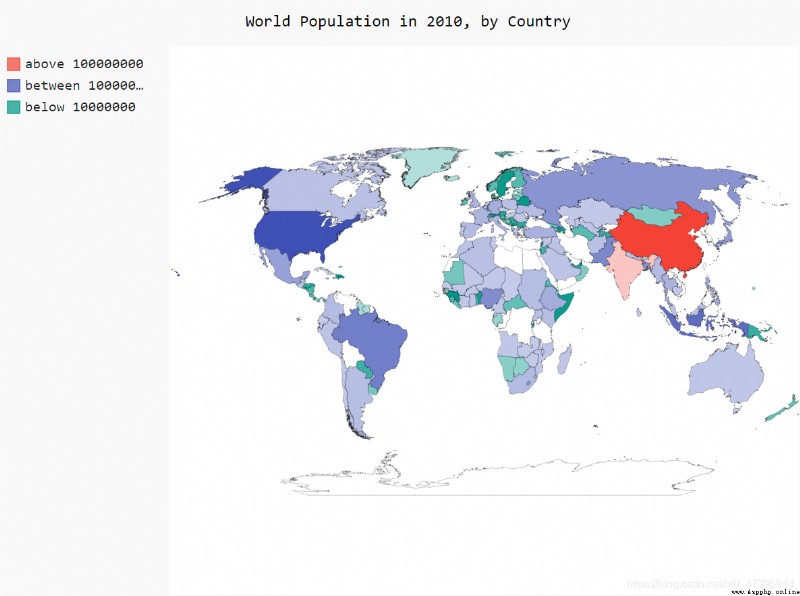
(6) premium 2.0—— Custom map style
When customizing map styles , Need to call pygal The module comes with its own style module , Custom style settings
1、 Import related packages
#Pygal Styles are stored in modules style in , We imported styles from this module RotateStyle
from pygal.style import RotateStyle, LightColorizedStyle
#RotateStyle You can set your favorite color
#LightColorizedStyle Color highlighting can be set
2、 Application instance
# Create a new style instance ( Don't write base_style=)
new_wm_style = RotateStyle("#206790",base_style=LightColorizedStyle)
# When creating a map instance , Pass on style Parameters
new_wm=pygal.maps.world.World(style=new_wm_style)
【 Key points 】:
(1) Creating RotateStyle When an instance , Provide a 16 It's binary RGB Color arguments ,RotateStyle Returns a style object .
(2)LightColorizedStyle Call this class to set color highlighting
Situation 1 、 When using this class , Cannot directly control the color used , Default direct use python Primary color of
【 Usage method 】:
wm_style = LightColorizedStyle
# When creating an instance , Pass this parameter
Case 2 、 To use custom colors , Control map color
( At the same time, it can control the color and highlight the color ) call RotateStyle() class
wm_style=RotateStyle("#336699",base_style=LightColorizedStyle)
# When creating an instance , Pass this parameter