Python Data analysis zy, Analyze and visualize the comment data crawled from Ctrip
Analysis of monthly data in question 2
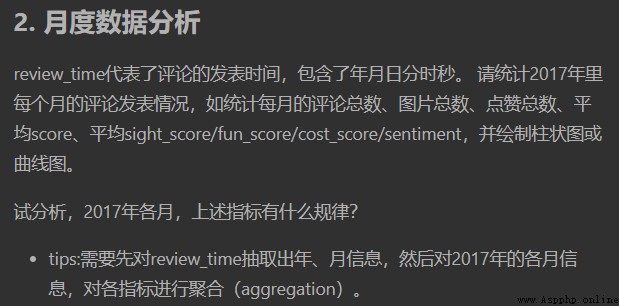
Monthly data analysis
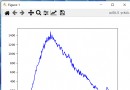
review_time Represents the time when the comment was published , It includes month, day, minute, hour and second . Please make statistics 2017 Comments published every month during the year , Such as counting the total number of comments every month 、 The total number of pictures 、 Total likes 、 flat [ all score、 Average sight_score/fun_score/cost_score/sentiment, And draw a histogram or curve .
Try to analyze ,2017 Months of the year , What are the rules of the above indicators ?
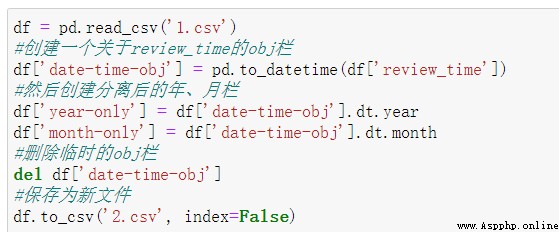
tips: It needs to be right first review_time Extract the year 、 Monthly information , Then on 2017 Monthly information of the year , Aggregate all indicators (aggregation).
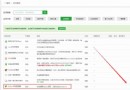
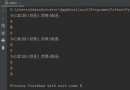
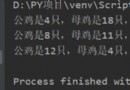
I have only completed the right review_time Year month separation of , The following aggregations and comments on each month score And so on , Ask for an answer !
My separation of years , The latter will not
Solve the problem !