The data analysis of this paper is in anaconda Medium Spyder In the middle of .
import pandas
from sklearn.linear_model import LinearRegression
import matplotlib
import matplotlib.pyplot as plt
The screenshot below is data.xlsx Data in ,sheet Name data1.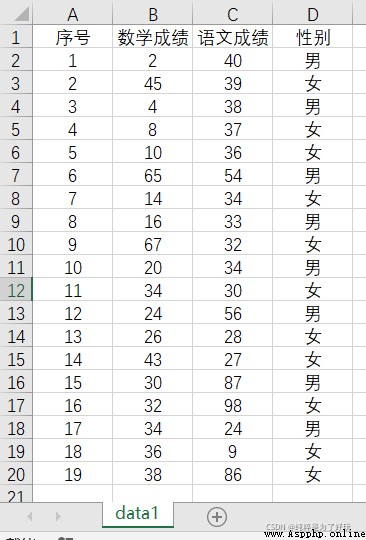
Execute the following code
# utilize pandas Inside read_excel function
# Pay attention to two places , First, write the file path ( Include the file name )
# Second, write which one in the import file sheet
data = pandas.read_excel(
'D:/7_science_and_technology/ Data analysis /data.xlsx',
sheet_name='data1'
give the result as follows :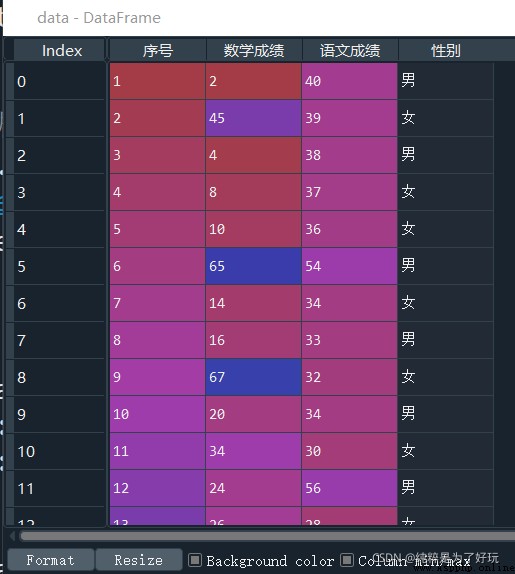
# utilize pandas Inside DataFrame Manually create
# ' Variable name ':[...,...,...,...,]
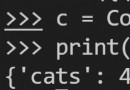
data_2 = pandas.DataFrame({
'catalog': ['A','B','C','D','E'],
'percent': [0.1, 0.15, 0.4, 0.6, 0.9]
})
give the result as follows :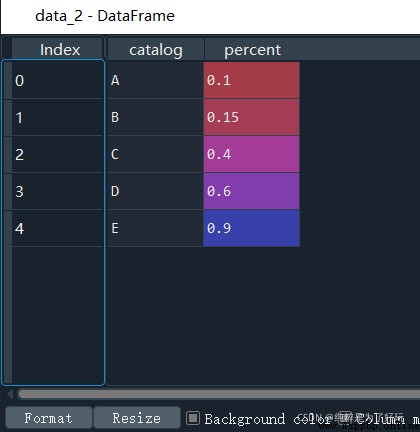
utilize plot.bar Function draw a histogram :
data_2.plot.bar(x = 'catalog', y='percent')
give the result as follows :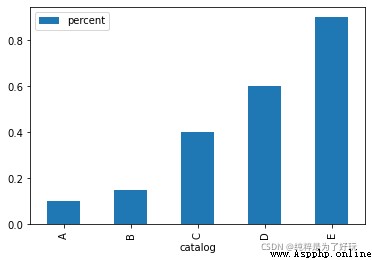
# True Stands for ascending order ,False For descending order
sortData = data.sort_values(
by = [' Math scores ',' Chinese achievement '],
ascending = [True, False]
)
give the result as follows :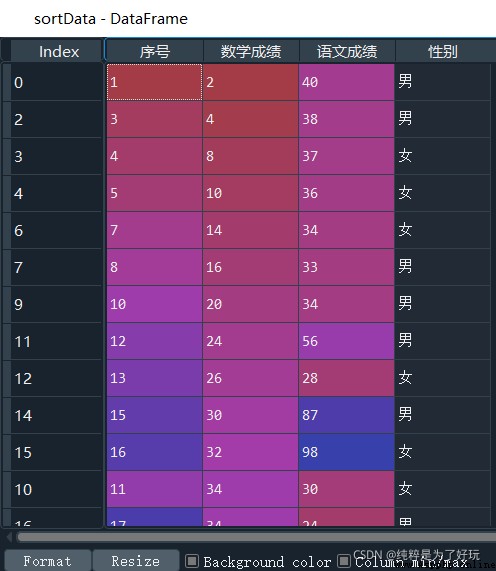
# Simple calculation of data
data[' Total score '] = data. Math scores + data. Chinese achievement
give the result as follows :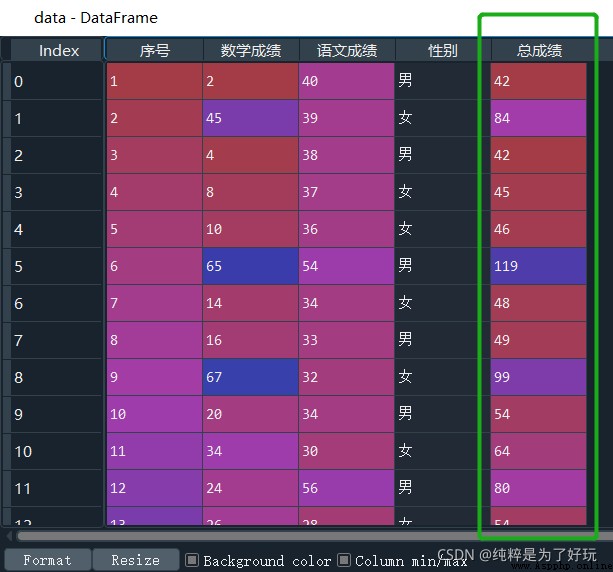
# Data pair 0-1 Standardization
data[' Chinese achievement standardization '] = round(
(data. Chinese achievement - data. Chinese achievement .min())/(
data. Chinese achievement .max() - data. Chinese achievement .min())
)
give the result as follows :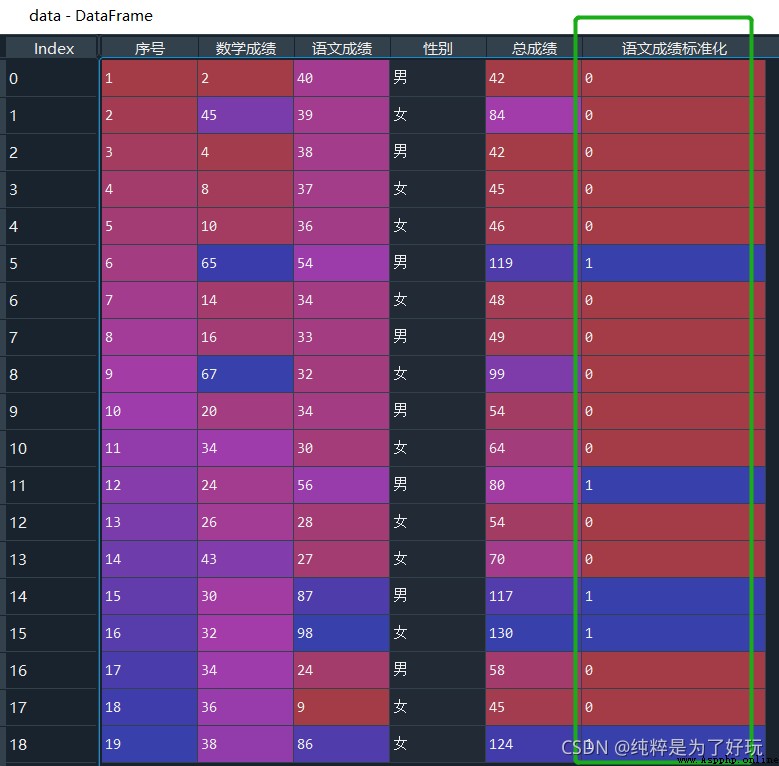
# Basic description statistics
print(data. Total score .describe())
give the result as follows :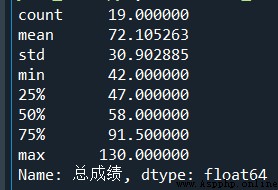
# Group statistics by sex
ga = data.groupby(by = [' Gender '])[' Chinese achievement '].agg('count')
print(ga)
print(ga.sum()) # The total number of cases
print(ga/ga.sum()) # Calculation scale
give the result as follows :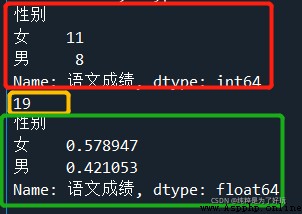
# Correlation analysis : Chinese achievement 、 Math scores
corrMatrix = data[[
' Math scores ',' Chinese achievement '
]].corr()
print(corrMatrix)
give the result as follows :
# Draw a scatter plot
#data.plot(' Math scores ',' Chinese achievement ', kind = 'scatter')
plt.scatter(data[' Math scores '], data[' Chinese achievement '])
give the result as follows :
# The regression model
x = data[[' Math scores ']]
y = data[[' Chinese achievement ']]
lrModel = LinearRegression()
lrModel.fit(x, y)
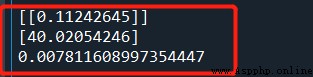
print(lrModel.coef_)
print(lrModel.intercept_)
# Accuracy of regression model
print(lrModel.score(x, y))