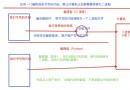
A report is a form 、 Charts and other formats to dynamically display data , So some people use this formula to describe the report :
report form = Various formats + Dynamic data
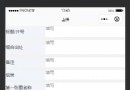
There are many third-party libraries supported in Python Write... In the program Excel file , Include xlwt、xlwings、openpyxl、xlswriter、pandas etc. , Among them xlwt Although it only supports writing xls Format Excel file , But the performance is good . So let's do that xlwt For example , To demonstrate how to Django Export from project Excel report form , For example, export a that contains all the teacher information Excel form .
def export_teachers_excel(request):
# Create Workbook
wb = xlwt.Workbook()
# Add sheet
sheet = wb.add_sheet(' Teacher information sheet ')
# Query the information of all teachers ( Be careful : This place needs to be optimized later )
queryset = Teacher.objects.all()
# towards Excel Write the header in the form
colnames = (' full name ', ' Introduce ', ' Good reviews ', ' Bad reviews ', ' Discipline ')
for index, name in enumerate(colnames):
sheet.write(0, index, name)
# Write the teacher's data to the cell
props = ('name', 'detail', 'good_count', 'bad_count', 'subject')
for row, teacher in enumerate(queryset):
for col, prop in enumerate(props):
value = getattr(teacher, prop, '')
if isinstance(value, Subject):
value = value.name
sheet.write(row + 1, col, value)
# preservation Excel
buffer = BytesIO()
wb.save(buffer)
# Write binary data into the message body of the response and set MIME type
resp = HttpResponse(buffer.getvalue(), content_type='application/vnd.ms-excel')
# The Chinese file name needs to be encoded with a percent sign
filename = quote(' teacher .xls')
# Tell the browser to download the file and the corresponding file name through the response header
resp['content-disposition'] = f'attachment; filename="{
filename}"'
return resp
mapping URL.
urlpatterns = [
# The above code is omitted here
path('excel/', views.export_teachers_excel),
# The following code is omitted here
]
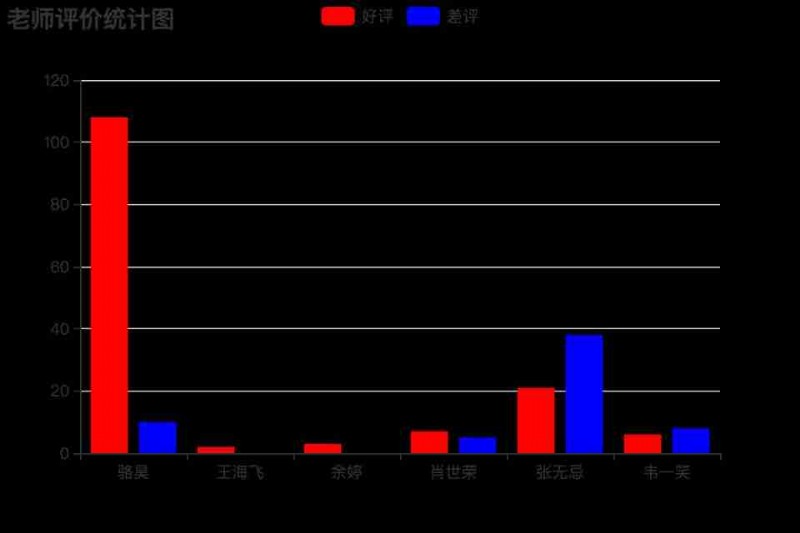
If the front-end statistical chart needs to be generated in the project , Can use Baidu's ECharts. The specific method is that the back-end returns the data required by the statistical chart by providing a data interface , Front end use ECharts To render the histogram 、 Broken line diagram 、 The pie chart 、 Scatter chart and other charts . For example, we need to generate a report that counts the positive and negative comments of all teachers , You can do it in the following way .
def get_teachers_data(request):
# Query the information of all teachers ( Be careful : This place also needs to be optimized later )
queryset = Teacher.objects.all()
# Put the teacher's name in a list with generative expression
names = [teacher.name for teacher in queryset]
# Use the generative formula to put the teacher's praise number in a list
good = [teacher.good_count for teacher in queryset]
# Use the generative formula to put the teacher's bad comments in a list
bad = [teacher.bad_count for teacher in queryset]
# return JSON Formatted data
return JsonResponse({
'names': names, 'good': good, 'bad': bad})
mapping URL.
urlpatterns = [
# The above code is omitted here
path('teachers_data/', views.export_teachers_excel),
# The following code is omitted here
]
Use ECharts Generate a histogram .
<!DOCTYPE html>
<html lang="en">
<head>
<meta charset="UTF-8">
<title> Teacher evaluation statistics </title>
</head>
<body>
<div id="main" ></div>
<p>
<a href="/"> Back to the home page </a>
</p>
<script src="https://cdn.bootcss.com/echarts/4.2.1-rc1/echarts.min.js"></script>
<script> var myChart = echarts.init(document.querySelector('#main')) fetch('/teachers_data/') .then(resp => resp.json()) .then(json => {
 var option = {
 color: ['#f00', '#00f'], title: {
 text: ' Teacher evaluation statistical chart ' }, tooltip: {
}, legend: {
 data:[' Praise ', ' Bad review '] }, xAxis: {
 data: json.names }, yAxis: {
}, series: [ {
 name: ' Praise ', type: 'bar', data: json.good }, {
 name: ' Bad review ', type: 'bar', data: json.bad } ] } myChart.setOption(option) }) </script>
</body>
</html>
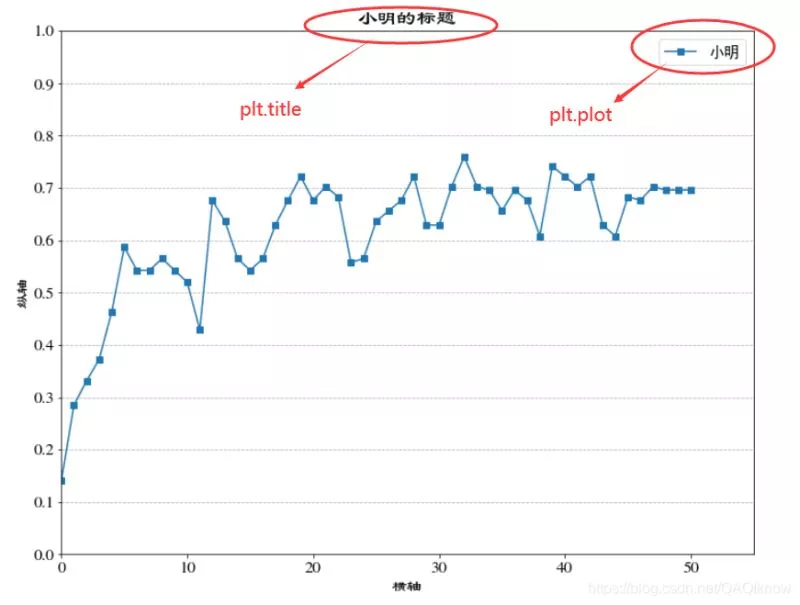
The operation effect is shown in the figure below .
Project development stage , It is necessary to display enough debugging information to assist developers in debugging code ; After the project goes online , The warning that appears when the system is running 、 It is also necessary to record errors and other information for relevant personnel to understand the system operation and maintain the code . Do these two things well , We need to Django Project configuration log .
Django The log configuration of can be basically carried out by referring to the official documents and combining the actual needs of the project , These contents can basically be copied from official documents , Then make local adjustments , Here are some reference configurations .
LOGGING = {

'version': 1,
# Whether to disable the existing logger
'disable_existing_loggers': False,
# Log formatter
'formatters': {

'simple': {

'format': '%(asctime)s %(module)s.%(funcName)s: %(message)s',
'datefmt': '%Y-%m-%d %H:%M:%S',
},
'verbose': {

'format': '%(asctime)s %(levelname)s [%(process)d-%(threadName)s] '
'%(module)s.%(funcName)s line %(lineno)d: %(message)s',
'datefmt': '%Y-%m-%d %H:%M:%S',
}
},
# Log filter
'filters': {

# Only in Django In profile DEBUG The value is True It works when
'require_debug_true': {

'()': 'django.utils.log.RequireDebugTrue',
},
},
# Log processor
'handlers': {

# Output to console
'console': {

'class': 'logging.StreamHandler',
'level': 'DEBUG',
'filters': ['require_debug_true'],
'formatter': 'simple',
},
# output to a file ( Cut once a week )
'file1': {

'class': 'logging.handlers.TimedRotatingFileHandler',
'filename': 'access.log',
'when': 'W0',
'backupCount': 12,
'formatter': 'simple',
'level': 'INFO',
},
# output to a file ( Cut once a day )
'file2': {

'class': 'logging.handlers.TimedRotatingFileHandler',
'filename': 'error.log',
'when': 'D',
'backupCount': 31,
'formatter': 'verbose',
'level': 'WARNING',
},
},
# Logger logger
'loggers': {

'django': {

# Log processor needed
'handlers': ['console', 'file1', 'file2'],
# Whether to propagate log information upward
'propagate': True,
# The level of logging ( Not necessarily the final log level )
'level': 'DEBUG',
},
}
}
You may have noticed , In the log configuration above formatters yes Log formatter , It represents how to format the output log , The format placeholders represent :
In log configuration handlers Used to specify Log processor , Simply put, it specifies whether the log is output to the console, a file, or a server on the network , Available processors include :
Each of the above log processors is assigned a name “level” Properties of , It represents the level of logs , Different log levels reflect the severity of the information recorded in the log .Python Six levels of logs are defined in , The order from low to high is :NOTSET、DEBUG、INFO、WARNING、ERROR、CRITICAL.
Last configured Loggers It is used to really output logs ,Django The framework provides a built-in recorder as shown below :
The log level configured in the logger may not be the final log level , Because you also need to refer to the log level configured in the log processor , Take the higher level of the two as the final log level .
Django-Debug-Toolbar It is an artifact to assist debugging and Optimization in the project development stage , As long as it is configured , You can easily view the project operation information shown in the following table , This information is important for debugging projects and optimization Web Application performance is crucial .
install Django-Debug-Toolbar.
pip install django-debug-toolbar
To configure - modify settings.py.
INSTALLED_APPS = [
'debug_toolbar',
]
MIDDLEWARE = [
'debug_toolbar.middleware.DebugToolbarMiddleware',
]
DEBUG_TOOLBAR_CONFIG = {

# introduce jQuery library
'JQUERY_URL': 'https://cdn.bootcss.com/jquery/3.3.1/jquery.min.js',
# Whether the toolbar is collapsed
'SHOW_COLLAPSED': True,
# Show toolbar or not
'SHOW_TOOLBAR_CALLBACK': lambda x: True,
}
To configure - modify urls.py.
if settings.DEBUG:
import debug_toolbar
urlpatterns.insert(0, path('__debug__/', include(debug_toolbar.urls)))
Use - As shown in the figure below , The configured Django-Debug-Toolbar after , A debugging toolbar will be seen on the right side of the page , The above includes various debugging information as described above , Including execution time 、 Project settings 、 Request header 、SQL、 Static resources 、 Templates 、 cache 、 Signals, etc , It's very convenient to check .
After configuring logs or Django-Debug-Toolbar after , We can export the teacher data to Excel The execution of the view function of the report , Here we focus on ORM Frame generated SQL What exactly does the query look like , I believe the results here will make you feel a little surprised . perform Teacher.objects.all() Then we can notice , Seen on the console or through Django-Debug-Toolbar Output SQL It looks like this :
SELECT `tb_teacher`.`no`, `tb_teacher`.`name`, `tb_teacher`.`detail`, `tb_teacher`.`photo`, `tb_teacher`.`good_count`, `tb_teacher`.`bad_count`, `tb_teacher`.`sno` FROM `tb_teacher`; args=()
SELECT `tb_subject`.`no`, `tb_subject`.`name`, `tb_subject`.`intro`, `tb_subject`.`create_date`, `tb_subject`.`is_hot` FROM `tb_subject` WHERE `tb_subject`.`no` = 101; args=(101,)
SELECT `tb_subject`.`no`, `tb_subject`.`name`, `tb_subject`.`intro`, `tb_subject`.`create_date`, `tb_subject`.`is_hot` FROM `tb_subject` WHERE `tb_subject`.`no` = 101; args=(101,)
SELECT `tb_subject`.`no`, `tb_subject`.`name`, `tb_subject`.`intro`, `tb_subject`.`create_date`, `tb_subject`.`is_hot` FROM `tb_subject` WHERE `tb_subject`.`no` = 101; args=(101,)
SELECT `tb_subject`.`no`, `tb_subject`.`name`, `tb_subject`.`intro`, `tb_subject`.`create_date`, `tb_subject`.`is_hot` FROM `tb_subject` WHERE `tb_subject`.`no` = 101; args=(101,)
SELECT `tb_subject`.`no`, `tb_subject`.`name`, `tb_subject`.`intro`, `tb_subject`.`create_date`, `tb_subject`.`is_hot` FROM `tb_subject` WHERE `tb_subject`.`no` = 103; args=(103,)
SELECT `tb_subject`.`no`, `tb_subject`.`name`, `tb_subject`.`intro`, `tb_subject`.`create_date`, `tb_subject`.`is_hot` FROM `tb_subject` WHERE `tb_subject`.`no` = 103; args=(103,)
The problem here is often called “1+N Inquire about ”( or “N+1 Inquire about ”), Originally, only one piece of data is needed to obtain the teacher's data SQL, But because the teacher is related to the subject , When we find N The teacher's data ,Django Of ORM The framework sends a message to the database N strip SQL Go to inquire the information of the subject of the teacher . Every one of them SQL Execution will have a large overhead and will bring pressure to the database server , If you can be in one SQL It is certainly a better way to complete the inquiry of teachers and subjects , This is also easy to do , I believe you have figured out how to do it . Yes , We can use connection query , But in use Django Of ORM How to do this in the framework ? For many to one associations ( Such as teachers and subjects in voting applications ), We can use QuerySet The use of select_related() Method to load the associated object ; For many to many Association ( Such as orders and goods in e-commerce websites ), We can use prefetch_related() Method to load the associated object .
Exporting teachers Excel In the view function of the report , We can optimize the code in the following way .
queryset = Teacher.objects.all().select_related('subject')
in fact , use ECharts In the view function that generates the front-end report , The operation of querying the data of teachers' positive and negative comments can also be optimized , Because in this case , We just need to get the teacher's name 、 The three data of positive and negative comments , But it is generated by default SQL Will query all fields of the teacher table . It can be used QuerySet Of only() Method to specify the attribute to be queried , It can also be used. QuerySet Of defer() Method to specify properties that do not need to be queried for the time being , Generated in this way SQL The column to be queried will be specified through projection operation , So as to improve query performance , The code is as follows :
queryset = Teacher.objects.all().only('name', 'good_count', 'bad_count')
Of course , If you want to count the average number of teachers' positive and negative comments in each discipline , utilize Django Of ORM The framework can also do , The code is as follows :
queryset = Teacher.objects.values('subject').annotate(
good=Avg('good_count'), bad=Avg('bad_count'))
What we got here QuerySet The elements in are dictionary objects , There are three sets of key value pairs in each dictionary , They represent discipline numbers subject、 On behalf of the number of positive comments good And those representing negative ratings bad. If you want to get the name of the subject instead of the number , You can adjust the code in the following way :
queryset = Teacher.objects.values('subject__name').annotate(
good=Avg('good_count'), bad=Avg('bad_count'))
so ,Django Of ORM The framework allows us to complete grouping and aggregation queries in relational databases in an object-oriented manner .