problem
Solution
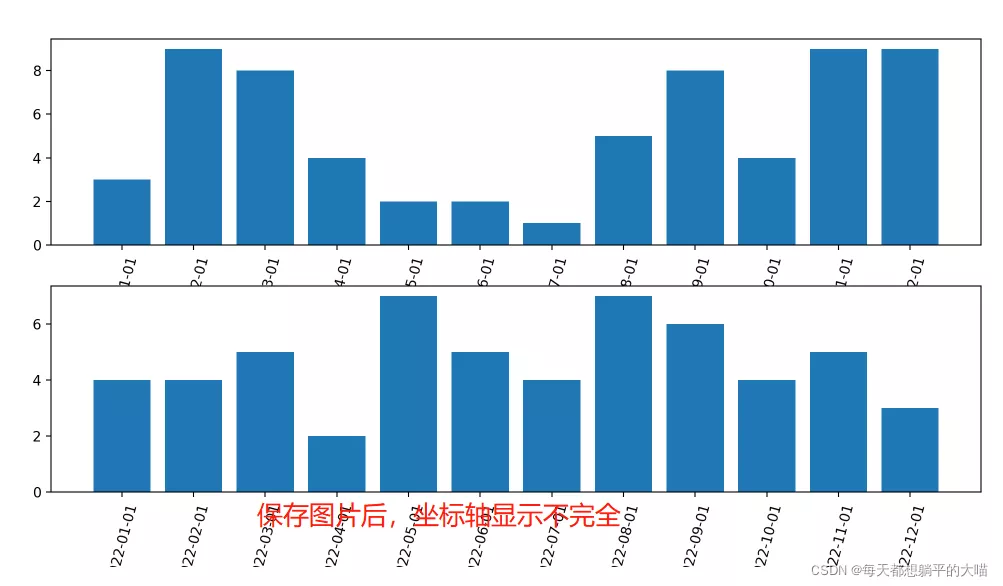
The problem of incomplete pictures when saving
Add : Use matplotlib How to make the coordinate axis display all label scales completely
summary
problem In the use of matplotlib When drawing , Sometimes the coordinate axes overlap when drawing , Incomplete display and incomplete picture saving . as follows :
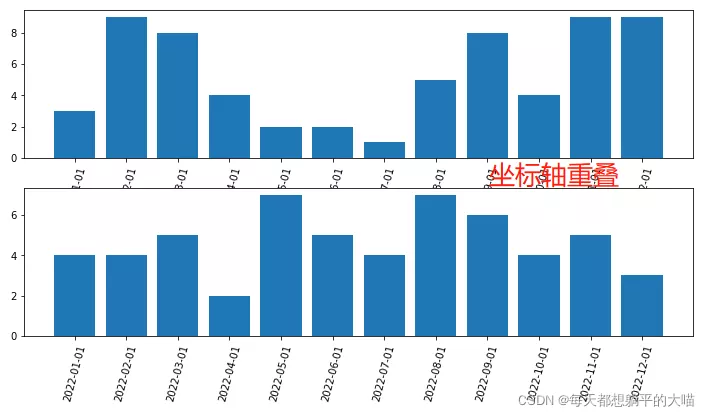
The problem of overlapping or incomplete display when drawing
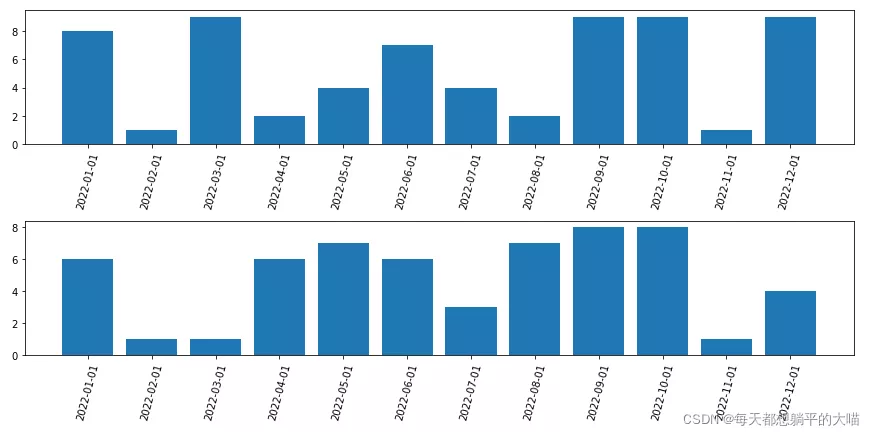
Add parameter settings when drawing tight_layout=True
After drawing all the subgraphs , Set up plt.tight_layout()
# add tight_layout=True Parameter setting fig, axes = plt.subplots(nrows=2, ncols=1, figsize=(12,6), tight_layout=True)labels = ['2022-{}-01'.format(str(i).zfill(2)) for i in range(1,13)]y1 = np.random.randint(low=1, high=10, size=12)y2 = np.random.randint(low=1, high=10, size=12)axes[0].bar(labels, y1)axes[0].set_xticks(labels)axes[0].set_xticklabels(labels, rotation=75)axes[1].bar(labels, y2)axes[1].set_xticks(labels)axes[1].set_xticklabels(labels, rotation=75)plt.savefig('test.png', dpi=200)fig, axes = plt.subplots(nrows=2, ncols=1, figsize=(12,6))labels = ['2022-{}-01'.format(str(i).zfill(2)) for i in range(1,13)]y1 = np.random.randint(low=1, high=10, size=12)y2 = np.random.randint(low=1, high=10, size=12)axes[0].bar(labels, y1)axes[0].set_xticks(labels)axes[0].set_xticklabels(labels, rotation=75)axes[1].bar(labels, y2)axes[1].set_xticks(labels)axes[1].set_xticklabels(labels, rotation=75)plt.tight_layout()# Add... Here plt.tight_layout(), Remember to draw all the subgraphs plt.savefig('test.png', dpi=200)The effect is as follows :
stay plt.savefig Add bbox_inches='tight’ Parameter setting
fig, axes = plt.subplots(nrows=2, ncols=1, figsize=(12,6), tight_layout=True)labels = ['2022-{}-01'.format(str(i).zfill(2)) for i in range(1,13)]y1 = np.random.randint(low=1, high=10, size=12)y2 = np.random.randint(low=1, high=10, size=12)axes[0].bar(labels, y1)axes[0].set_xticks(labels)axes[0].set_xticklabels(labels, rotation=75)axes[1].bar(labels, y2)axes[1].set_xticks(labels)axes[1].set_xticklabels(labels, rotation=75)plt.savefig('test.png', dpi=600, bbox_inches='tight')# savefig Time to join bbox_inches='tight' Parameter setting Add : Use matplotlib How to make the coordinate axis display all label scales completely In the use of matplotlib when , Because of the large amount of data , Under default settings , Use plot Isochronous , Will x,y The scale of the shaft is reduced by a certain proportion , Such as :1,2,3,4,5,6,7,8,9,10 It will be displayed. 2,4,6,8,10 etc. , The solution is to use xticks() and yticks():
xticks(ticks=None, labels=None, **kwargs)
ticks:x The value displayed by the axis ( type :list), If it is empty , be x No value will be displayed on the axis ;
labels: Label item , When ticks Isn't empty ,labels Content will be overwritten ticks The content of
**kwargs: Control the layout of label content
Return:
locs: return x List of axis coordinates
labels: return x Axis label list
summaryThis is about python matplotlib This is the article to solve the problems of incomplete display of overlapping coordinate axes when drawing and incomplete picture saving , More about matplotlib When drawing, the coordinate axes overlap and display incomplete content. Please search the previous articles of software development network or continue to browse the relevant articles below. I hope you will support software development network more in the future !