The previous section describes how to draw basic images , This time I will introduce the style of drawing the image
0. View all drawing styles
mpf.available_styles()
Output results :
[‘blueskies’,
‘brasil’,
‘charles’,
‘checkers’,
‘classic’,
‘default’,
‘mike’,
‘nightclouds’,
‘sas’,
‘starsandstripes’,
‘yahoo’]
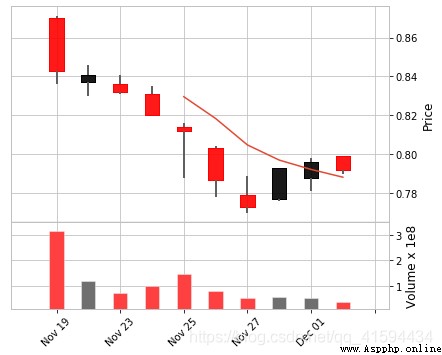
1.charles, Red falls , Green rise
mpf.plot(data.iloc[:100],type='candle',)
charles Pattern result 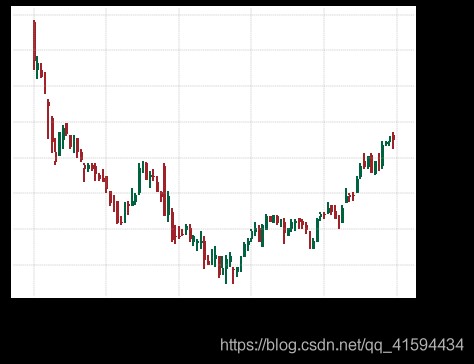
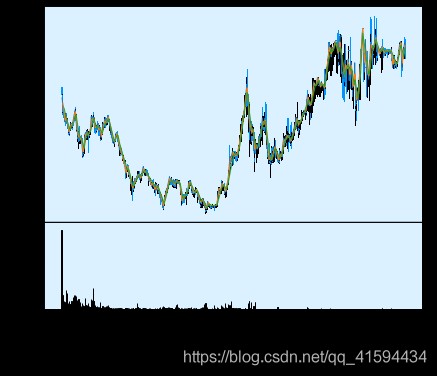
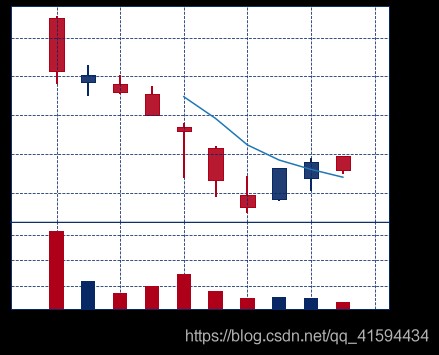
2.blueskies
mpf.plot(df,**kwargs,style='blueskies')
3.checkers
mpf.plot(df.iloc[:10,:],**kwargs,style='checkers')
4.sas
mpf.plot(df.iloc[:10,:],**kwargs,style='sas')
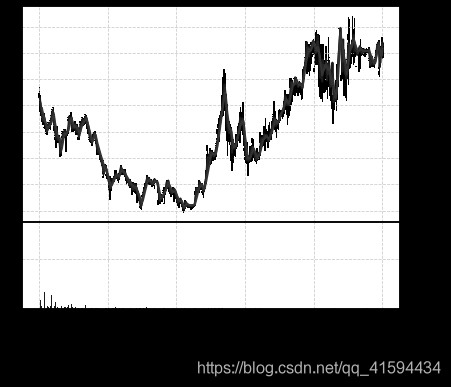
5.classic
mpf.plot(df,**kwargs,style='classic')