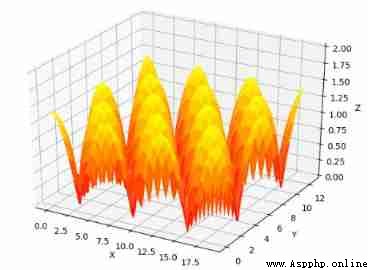
import matplotlib.pyplot as pltimport numpy as npfrom mpl_toolkits.mplot3d import Axes3Dfig = plt.figure()ax = fig.gca(projection='3d')x, y = np.mgrid[0:6 * np.pi:0.25, 0:4 * np.pi:0.25]z = np.sqrt(np.abs(np.cos(x) + np.cos(y)))surf = ax.plot_surface(x, y, z, cmap='autumn', cstride=2, rstride=2)ax.set_xlabel("X")ax.set_ylabel("Y")ax.set_zlabel("Z")ax.set_zlim(0, 2)plt.show()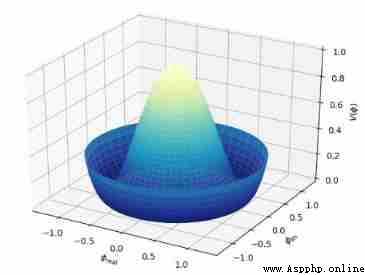
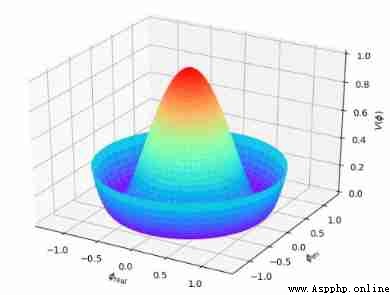
from matplotlib import pyplot as pltimport numpy as npfrom mpl_toolkits.mplot3d import Axes3Dfig = plt.figure()ax = fig.add_subplot(111, projection='3d')r = np.linspace(0, 1.25, 50)p = np.linspace(0, 2*np.pi, 50)r, p = np.meshgrid(r, p)z = ((r ** 2 - 1) ** 2)# Express the mesh in the cartesian system.x, y = r * np.cos(p), r * np.sin(p)# Plot the surface.ax.plot_surface(x, y, z, cmap=plt.cm.YlGnBu_r)# Tweak the limits and add latex math labels.ax.set_zlim(0, 1)ax.set_xlabel(r'$\phi_\mathrm{real}$')ax.set_ylabel(r'$\phi_\mathrm{im}$')ax.set_zlabel(r'$V(\phi)$')plt.show() Figure 2 just put LIne17 The last change is : cmap=plt.get_cmap(‘rainbow’) that will do
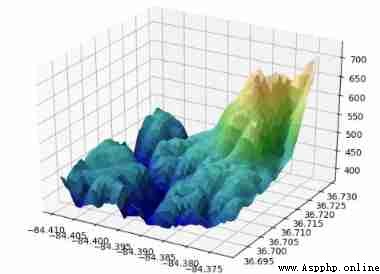
from matplotlib import cbookfrom matplotlib import cmfrom matplotlib.colors import LightSourceimport matplotlib.pyplot as pltimport numpy as npfrom mpl_toolkits.mplot3d import Axes3Dfilename = cbook.get_sample_data('jacksboro_fault_dem.npz', asfileobj=False)with np.load(filename) as dem: z = dem['elevation'] nrows, ncols = z.shape x = np.linspace(dem['xmin'], dem['xmax'], ncols) y = np.linspace(dem['ymin'], dem['ymax'], nrows) x, y = np.meshgrid(x, y)region = np.s_[5:50, 5:50]x, y, z = x[region], y[region], z[region]fig, ax = plt.subplots(subplot_kw=dict(projection='3d'))ls = LightSource(270, 45)rgb = ls.shade(z, cmap=cm.gist_earth, vert_exag=0.1, blend_mode='soft')surf = ax.plot_surface(x, y, z, rstride=1, cstride=1, facecolors=rgb, linewidth=0, antialiased=False, shade=False)plt.show()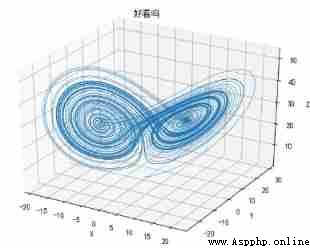
# -*- coding: utf-8 -*-import numpy as npimport matplotlibimport matplotlib.pyplot as pltfrom mpl_toolkits.mplot3d import Axes3Dmatplotlib.rcParams['font.sans-serif'] = ['SimHei']matplotlib.rcParams['axes.unicode_minus'] = Falsedef lorenz(x, y, z, s=10, r=28, b=2.667): x_dot = s*(y - x) y_dot = r*x - y - x*z z_dot = x*y - b*z return x_dot, y_dot, z_dotdt = 0.01stepCnt = 10000xs = np.empty((stepCnt + 1,))ys = np.empty((stepCnt + 1,))zs = np.empty((stepCnt + 1,))xs[0], ys[0], zs[0] = (0., 1., 1.05)for i in range(stepCnt): x_dot, y_dot, z_dot = lorenz(xs[i], ys[i], zs[i]) xs[i + 1] = xs[i] + (x_dot * dt) ys[i + 1] = ys[i] + (y_dot * dt) zs[i + 1] = zs[i] + (z_dot * dt)fig = plt.figure()ax = fig.gca(projection='3d')ax.plot(xs, ys, zs, lw=0.5)ax.set_xlabel("X")ax.set_ylabel("Y")ax.set_zlabel("Z")ax.set_title(" Good-looking? ")plt.show()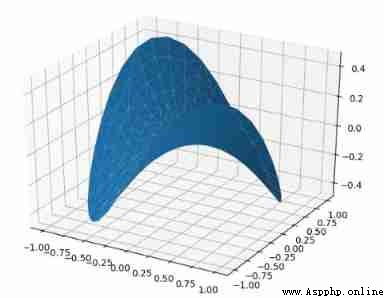
import matplotlib.pyplot as pltimport numpy as npfrom mpl_toolkits.mplot3d import Axes3Dfig = plt.figure()ax = fig.gca(projection='3d')n_radii = 8n_angles = 36radii = np.linspace(0.125, 1.0, n_radii)angles = np.linspace(0, 2*np.pi, n_angles, endpoint=False)angles = np.repeat(angles[..., np.newaxis], n_radii, axis=1)x = np.append(0, (radii*np.cos(angles)).flatten())y = np.append(0, (radii*np.sin(angles)).flatten())z = np.sin(-x*y)ax.plot_trisurf(x, y, z, linewidth=0.2, antialiased=True)plt.show()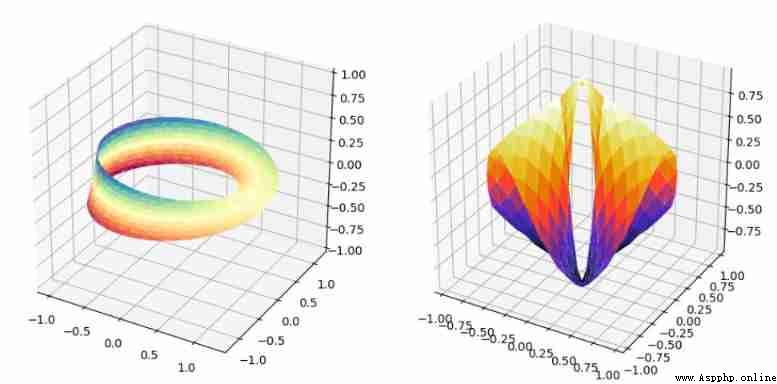
import numpy as npimport matplotlib.pyplot as pltimport matplotlib.tri as mtrifrom mpl_toolkits.mplot3d import Axes3Dfig = plt.figure(figsize=plt.figaspect(0.5))u = np.linspace(0, 2.0 * np.pi, endpoint=True, num=50)v = np.linspace(-0.5, 0.5, endpoint=True, num=10)u, v = np.meshgrid(u, v)u, v = u.flatten(), v.flatten()# triplex = (1 + 0.5 * v * np.cos(u / 2.0)) * np.cos(u)y = (1 + 0.5 * v * np.cos(u / 2.0)) * np.sin(u)z = 0.5 * v * np.sin(u / 2.0)tri = mtri.Triangulation(u, v)ax = fig.add_subplot(1, 2, 1, projection='3d')ax.plot_trisurf(x, y, z, triangles=tri.triangles, cmap=plt.cm.Spectral)ax.set_zlim(-1, 1)n_angles = 36n_radii = 8min_radius = 0.25radii = np.linspace(min_radius, 0.95, n_radii)angles = np.linspace(0, 2*np.pi, n_angles, endpoint=False)angles = np.repeat(angles[..., np.newaxis], n_radii, axis=1)angles[:, 1::2] += np.pi/n_anglesx = (radii*np.cos(angles)).flatten()y = (radii*np.sin(angles)).flatten()z = (np.cos(radii)*np.cos(angles*3.0)).flatten()triang = mtri.Triangulation(x, y)xmid = x[triang.triangles].mean(axis=1)ymid = y[triang.triangles].mean(axis=1)mask = np.where(xmid**2 + ymid**2 < min_radius**2, 1, 0)triang.set_mask(mask)ax = fig.add_subplot(1, 2, 2, projection='3d')ax.plot_trisurf(triang, z, cmap=plt.cm.CMRmap)plt.show()author : Xinggong Beichen
this paper [ 【Python】Matplotlibの3D Drawing reward ] Included in Game programming ️ - Python, A game development favorite ~
If the picture is not displayed for a long time , Please use Chrome browser .