This section adds image display content
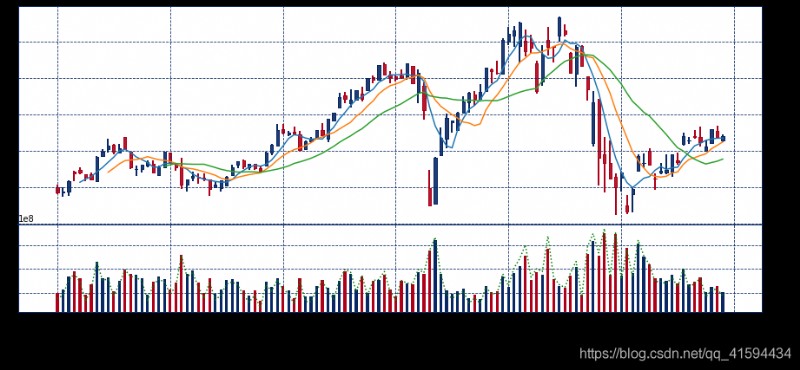
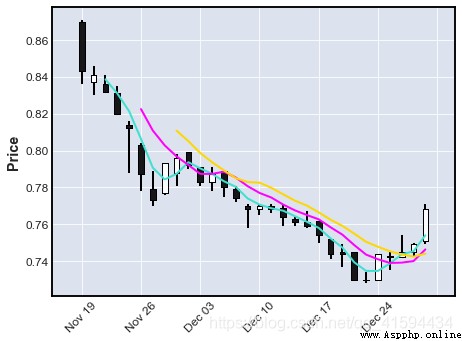
1. Increase the moving average
mpf.plot(data.iloc[:30],type='candle',mav=(3,6,9))
2. Display transaction volume
mpf.plot(data.iloc[:50],type='candle',mav=(3,6,9),volume=True,)

3. Increase transaction volume
apds = [mpf.make_addplot((df["Money"][-120:-1]),panel='lower',color='g',linestyle='dotted')]
mpf.plot(data.iloc[-120:-1],addplot=apds,figscale=1,mav=(5,10,20),volume=True,figratio=(17,7),type='candle', )
The color can be adjusted by itself