Visualization package Pygal Generate scalable vector graphics files
The results of the analysis , Count the number of occurrences of each point
Draw histogram
Roll two dice at the same time
Roll two dice with different numbers of sides at the same time
Visualization package Pygal Generate scalable vector graphics filesIt can automatically zoom in and out on screens of different sizes , Show chart
# install pygalpip install pygal''' Want to know Pygal What kind of charts can be generated , Accessible http://www.pygal.org/ single click document, Click on chart types, Each example contains source code '''from random import randint# Create a class of dice class Die(): def __init__(self,num_sides = 6): self.num_sides = num_sides def roll(self): # Returns a message located at 1 And the number of dice faces return randint(1, self.num_sides)# Dice die = Die()# Create a list , Store the results in a list results = [] # cast 100 Time for roll_num in range(100): result = die.roll() results.append(result)print(results)[3, 4, 2, 2, 6, 5, 5, 5, 2, 3, 1, 4, 3, 2, 1, 2, 3, 6, 6, 5, 5, 3, 2, 3, 1, 1, 4, 1, 4, 6, 1, 6, 2, 3, 4, 6, 2, 5, 5, 1, 6, 1, 5, 4, 3, 3, 4, 5, 6, 3, 5, 1, 4, 3, 5, 6, 6, 6, 4, 6, 5, 6, 5, 4, 6, 3, 1, 4, 1, 4, 2, 1, 1, 4, 4, 4, 2, 3, 1, 4, 6, 2, 1, 5, 6, 2, 2, 6, 6, 3, 6, 2, 6, 6, 4, 4, 2, 1, 1, 6] The results of the analysis , Count the number of occurrences of each point frequencies = []for value in range(1, die.num_sides+1): frequency = results.count(value) frequencies.append(frequency)print(frequencies)[10, 23, 13, 9, 26, 19] Draw histogram import pygalhist = pygal.Bar()hist.title = 'results of rolling one d6 100 times'hist.x_lables = ['1', '2', '3', '4', '5', '6']hist.x_title = 'result'hist.y_title = 'frequency of result'hist.add('d6', frequencies)# Render graph as SVG file , Need to open browser , To view the generated histogram hist.render_to_file('die_visual.svg')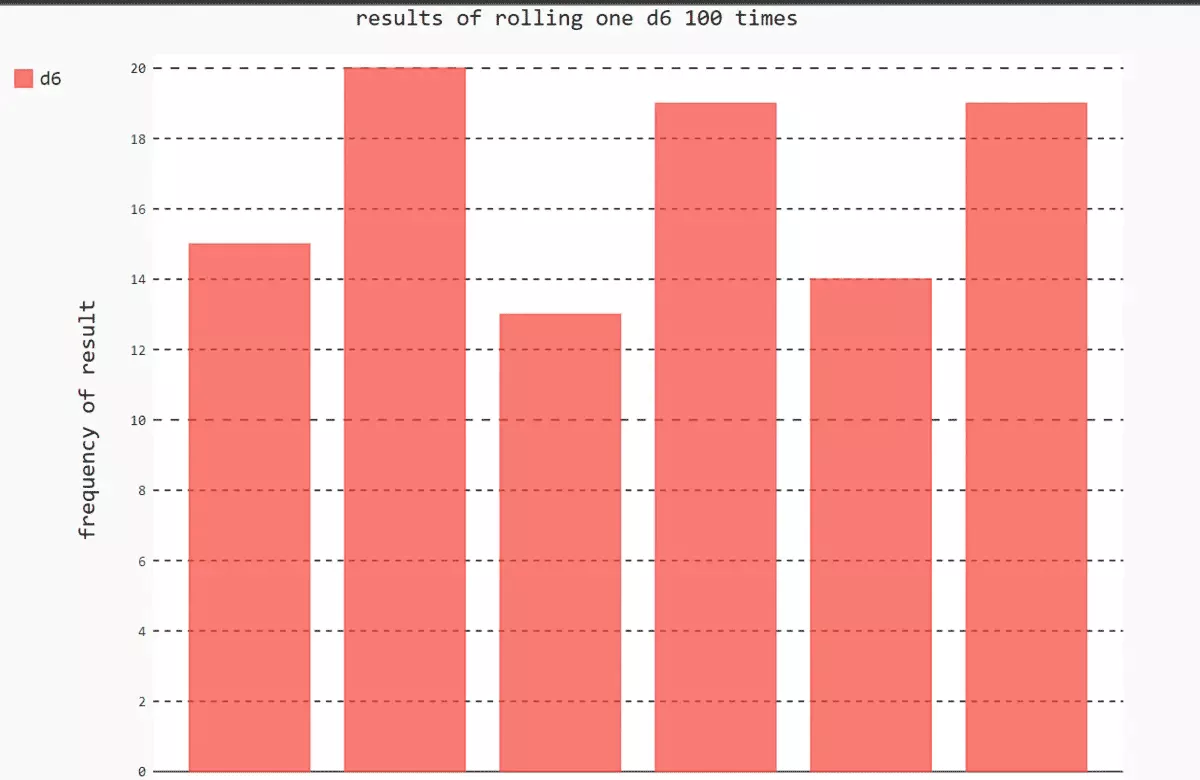
from random import randint# Create a class of dice class Die(): def __init__(self,num_sides = 6): self.num_sides = num_sides def roll(self): # Returns a message located at 1 And the number of dice faces return randint(1, self.num_sides)# Dice die1 = Die()die2 = Die()# Create a list , Store the results in a list results = [] # cast 100 Time for roll_num in range(100): result = die1.roll() + die2.roll() results.append(result)print(results)# The results of the analysis , Count the number of occurrences of each point frequencies = []max_result = die1.num_sides + die2.num_sidesfor value in range(1, max_result+1): frequency = results.count(value) frequencies.append(frequency)print(frequencies)# Draw histogram import pygalhist = pygal.Bar()hist.title = 'results of rolling one d6 dice 100 times'hist.x_lables = ['2', '3', '4', '5', '6', '7', '8', '9', '10', '11', '12']hist.x_title = 'result'hist.y_title = 'frequency of result'hist.add('d6 + d6', frequencies)# Render graph as SVG file , Need to open browser , To view the generated histogram hist.render_to_file('die_visual.svg')[4, 7, 4, 5, 8, 4, 3, 6, 8, 9, 8, 11, 9, 11, 8, 8, 5, 6, 10, 5, 11, 7, 4, 3, 12, 12, 7, 2, 4, 9, 9, 5, 7, 10, 4, 7, 4, 6, 5, 6, 7, 2, 7, 9, 7, 6, 11, 5, 9, 6, 11, 4, 8, 10, 7, 9, 5, 4, 3, 7, 4, 10, 5, 7, 2, 6, 4, 2, 2, 5, 5, 9, 6, 3, 6, 10, 12, 7, 4, 11, 8, 6, 10, 5, 7, 5, 5, 7, 9, 4, 11, 6, 7, 8, 6, 11, 6, 4, 3, 12][0, 5, 5, 14, 13, 13, 15, 8, 9, 6, 8, 4]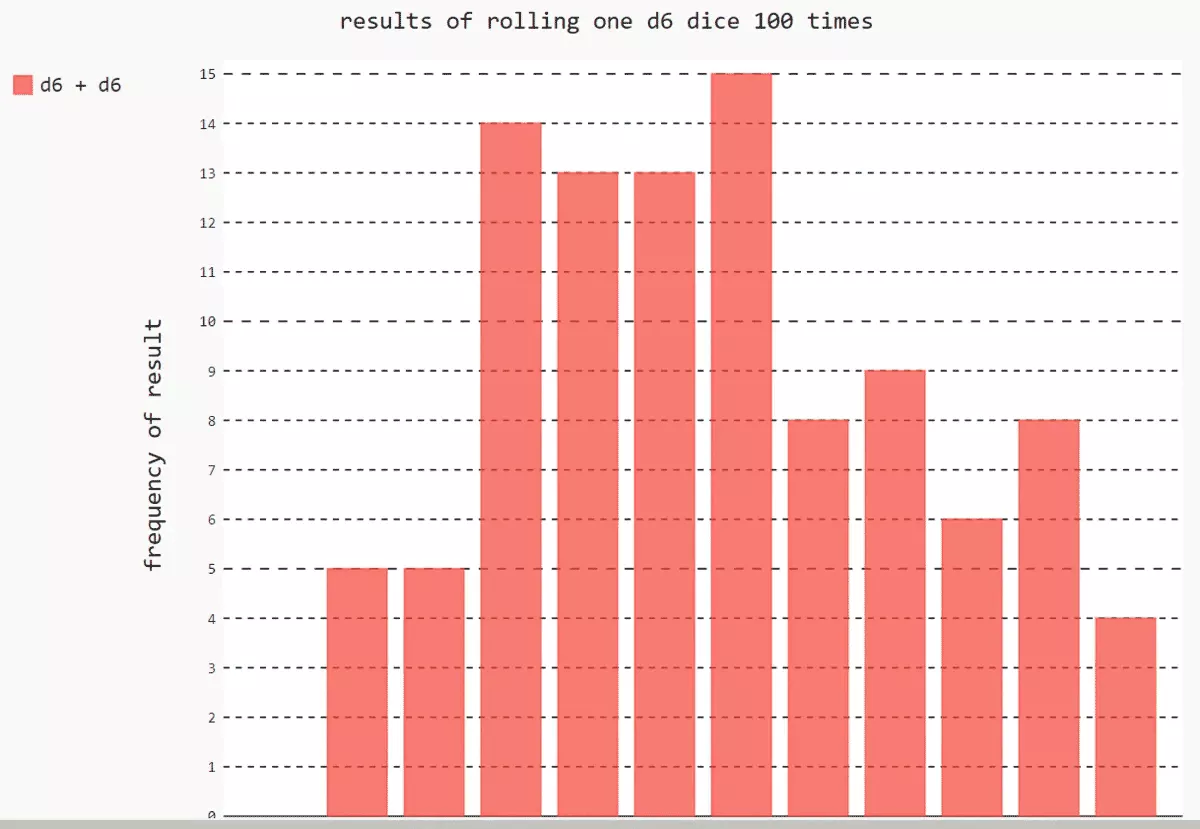
from random import randint# Create a class of dice class Die(): def __init__(self,num_sides = 6): self.num_sides = num_sides def roll(self): # Returns a message located at 1 And the number of dice faces return randint(1, self.num_sides)# Dice die1 = Die()die2 = Die(10)# Create a list , Store the results in a list results = [] # cast 100 Time for roll_num in range(100): result = die1.roll() + die2.roll() results.append(result)print(results)# The results of the analysis , Count the number of occurrences of each point frequencies = []max_result = die1.num_sides + die2.num_sidesfor value in range(1, max_result+1): frequency = results.count(value) frequencies.append(frequency)print(frequencies)# Draw histogram import pygalhist = pygal.Bar()hist.title = 'results of rolling one d10 dice 100 times'hist.x_lables = ['2', '3', '4', '5', '6', '7', '8', '9', '10', '11', '12', '13', '14','15','16']hist.x_title = 'result'hist.y_title = 'frequency of result'hist.add('d6 + d10', frequencies)# Render graph as SVG file , Need to open browser , To view the generated histogram hist.render_to_file('die_visual.svg')[5, 3, 6, 13, 8, 9, 10, 11, 11, 4, 5, 14, 11, 10, 11, 8, 14, 12, 16, 8, 9, 11, 7, 11, 9, 2, 8, 9, 9, 10, 7, 8, 12, 11, 8, 12, 9, 9, 10, 11, 8, 14, 10, 12, 10, 7, 12, 5, 4, 8, 6, 7, 7, 11, 9, 16, 6, 13, 6, 10, 6, 7, 16, 9, 14, 5, 7, 12, 8, 9, 11, 11, 6, 11, 5, 8, 11, 16, 4, 10, 5, 10, 13, 4, 9, 9, 11, 9, 11, 13, 7, 13, 13, 5, 5, 4, 5, 3, 12, 14][0, 1, 2, 5, 9, 6, 8, 10, 13, 9, 15, 7, 6, 5, 0, 4]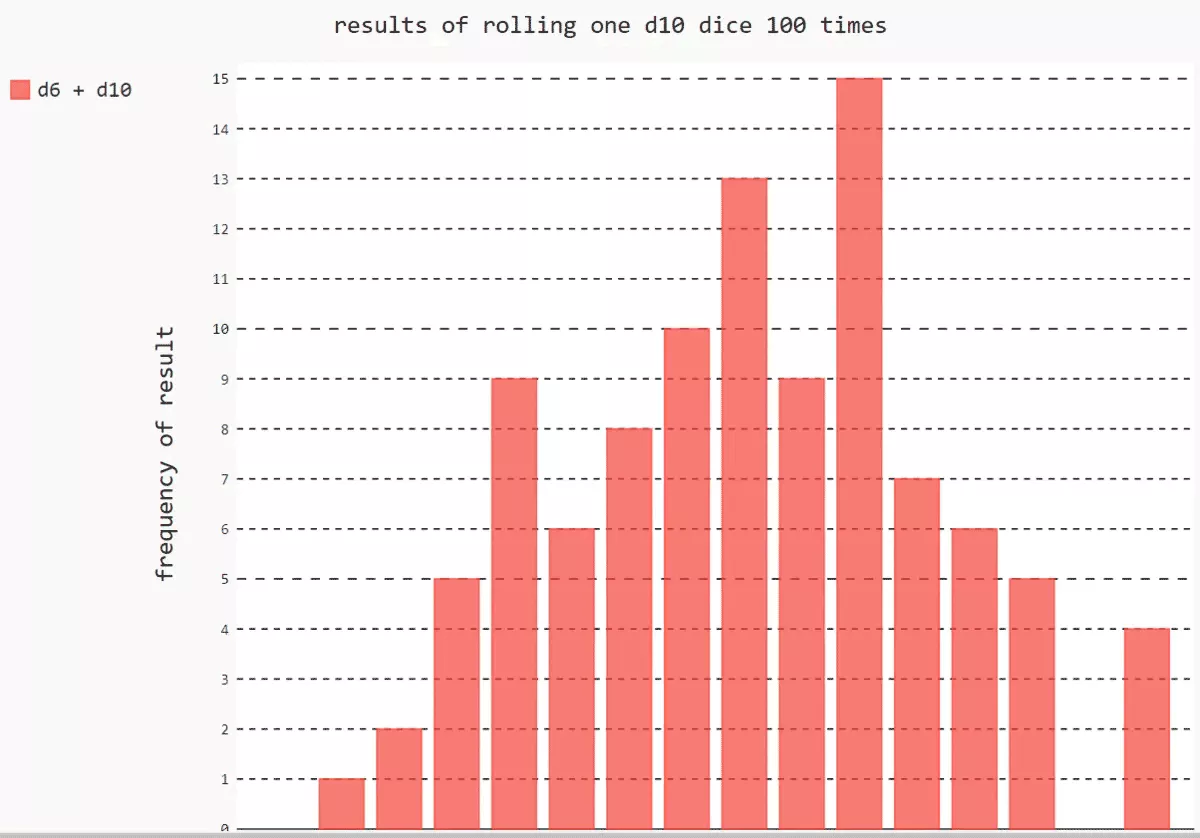
That's all python Data visualization pygal The details of the simulation dice implementation example , More about python pygal For information about simulated dice, please pay attention to other relevant articles on the software development network !