One 、 Single factor analysis linear fitting
Two 、 Implement geocoding
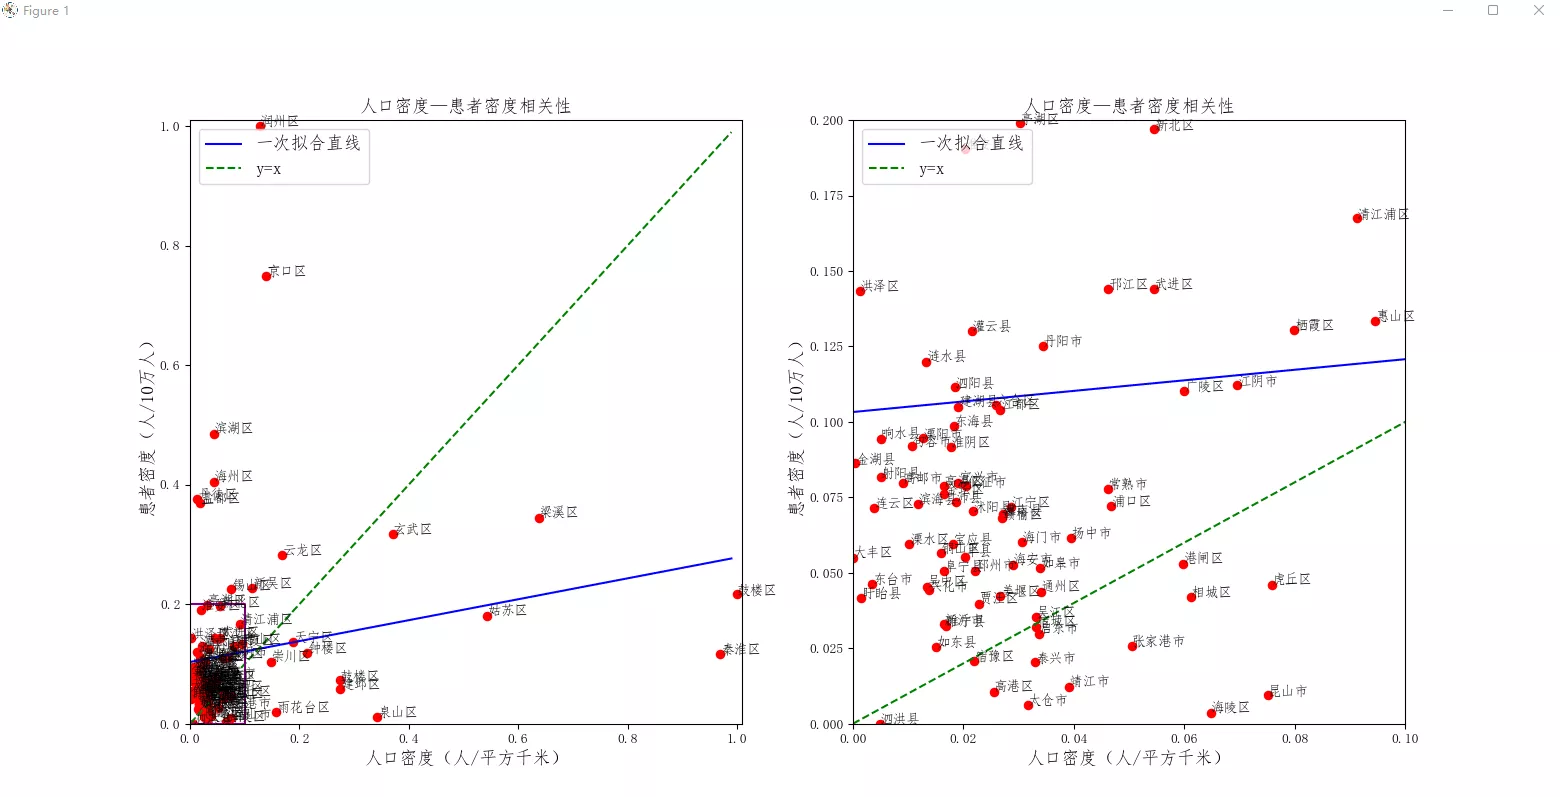
One 、 Single factor analysis linear fittingfunction : Linear fitting , Single factor analysis , Carry out linear fitting to the scatter diagram , And enlarge the local position of the scatter diagram
Input : Some xlsx file , contain ' Patient density ( people /10 ten thousand people )' and ' Population density ( people / Square kilometers )' Two
Output : The two columns of data are linearly fitted , Draw a scatter
Implementation code :
import pandas as pdfrom pylab import mplfrom scipy import optimizeimport numpy as npimport matplotlib.pyplot as pltdef f_1(x, A, B): return A*x + Bdef draw_cure(file): data1=pd.read_excel(file) data1=pd.DataFrame(data1) hz=list(data1[' Patient density ( people /10 ten thousand people )']) rk=list(data1[' Population density ( people / Square kilometers )']) hz_gy=[] rk_gy=[] for i in hz: hz_gy.append((i-min(hz))/(max(hz)-min(hz))) for i in rk: rk_gy.append((i-min(rk))/(max(rk)-min(rk))) n=[' Xuanwu District ',' Qinhuai District ',' Jianye District ',' Gulou District ',' Pukou District ',' Qixia District ',' Yuhuatai District ',' Jiangning District ',' Liuhe District ',' Lishui District ',' Gaochun District ', ' Xishan District ',' Huishan District ',' Lakeside area ',' Liangxi district ',' Xinwu District ',' Jiangyin City ',' Yixing City ', ' Gulou District ',' Yunlong District ',' Jiawang District ',' Quanshan district ',' Tongshan district ',' Fengxian ',' Peixian ',' Suining County ',' Xinyi City ',' Pizhou City ', ' Tinian District ',' Bell tower area ',' New North ',' Wujin District ',' Jintan District ',' Liyang City ', ' Huqiu District ',' Wuzhong District ',' Xiangcheng District ',' Gusu District ',' Wujiang District ',' Changshu ',' Zhangjiagang City ',' city of Kunshan ',' Taicang City ', ' Chongchuan District ',' Gate area ',' Tongzhou District ',' Rudong County ',' Qidong City ',' Rugao City ',' Haimen City ',' Hai'an city ', ' Lianyun District ',' Haizhou District ',' Ganyu District ',' Donghai County ',' Guanyun County ',' Guannan County ', ' Huai'an District ',' Huaiyin District ',' Qingjiangpu district ',' Hongze district ',' Lianshui County ',' Xuyi county ',' Jinhu County ', ' Tinghu district ',' Yandu District ',' Dafeng district ',' Xiangshui County ',' Binhai County ',' Funing County ',' Sheyang County ',' Jianhu County ',' Dongtai City ', ' Guangling district ',' Hanjiang District ',' Jiangdu district ',' Baoying County ',' Yizheng City ',' Gaoyou City ', ' Jingkou District ',' Runzhou District ',' Dantu District ',' Danyang City ',' Yangzhong City ',' Jurong City ', ' Hailing District ',' Gaogang district ',' Jiangyan district ',' Xinghua City ',' Jingjiang City ',' Taixing City ', ' Suzhou District ',' Suyu District ',' Shuyang County ',' Siyang County ',' Sihong County '] mpl.rcParams['font.sans-serif'] = ['FangSong'] plt.figure(figsize=(16,8),dpi=98) p1 = plt.subplot(121) p2 = plt.subplot(122) p1.scatter(rk_gy,hz_gy,c='r') p2.scatter(rk_gy,hz_gy,c='r') p1.axis([0.0,1.01,0.0,1.01]) p1.set_ylabel(" Patient density ( people /10 ten thousand people )",fontsize=13) p1.set_xlabel(" Population density ( people / Square kilometers )",fontsize=13) p1.set_title(" Population density — Patient density correlation ",fontsize=13) for i,txt in enumerate(n): p1.annotate(txt,(rk_gy[i],hz_gy[i])) A1, B1 = optimize.curve_fit(f_1, rk_gy, hz_gy)[0] x1 = np.arange(0, 1, 0.01) y1 = A1*x1 + B1 p1.plot(x1, y1, "blue",label=' Fit a straight line once ') x2 = np.arange(0, 1, 0.01) y2 = x2 p1.plot(x2, y2,'g--',label='y=x') p1.legend(loc='upper left',fontsize=13) # # plot the box tx0 = 0;tx1 = 0.1;ty0 = 0;ty1 = 0.2 sx = [tx0,tx1,tx1,tx0,tx0] sy = [ty0,ty0,ty1,ty1,ty0] p1.plot(sx,sy,"purple") p2.axis([0,0.1,0,0.2]) p2.set_ylabel(" Patient density ( people /10 ten thousand people )",fontsize=13) p2.set_xlabel(" Population density ( people / Square kilometers )",fontsize=13) p2.set_title(" Population density — Patient density correlation ",fontsize=13) for i,txt in enumerate(n): p2.annotate(txt,(rk_gy[i],hz_gy[i])) p2.plot(x1, y1, "blue",label=' Fit a straight line once ') p2.plot(x2, y2,'g--',label='y=x') p2.legend(loc='upper left',fontsize=13) plt.show()if __name__ == '__main__': draw_cure("F:\ Medical big data project \ Revision of final paper \scientific report\ Rework \ Urban and county correlation analysis _2231.xls")Realization effect :
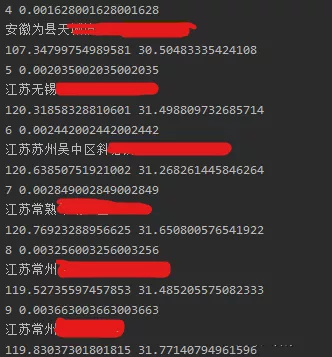
Input : Chinese address information , For example, Chongli, Dudu village, Tiancheng Town, Weixian County, Anhui Province 18 Number
Output : Latitude and longitude coordinates , for example 107.34799754989581 30.50483335424108
function : Obtain longitude and latitude coordinates according to Chinese address information
Implementation code :
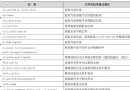
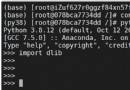
import jsonfrom urllib.request import urlopen,quoteimport xlrddef readXLS(XLS_FILE,sheet0): rb= xlrd.open_workbook(XLS_FILE) rs= rb.sheets()[sheet0] return rsdef getlnglat(adress): url = 'http://api.map.baidu.com/geocoding/v3/?address=' output = 'json' ak = 'fdi11GHN3GYVQdzVnUPuLSScYBVxYDFK' add = quote(adress)# Use quote Encoding In order to prevent Chinese garbled # add=adress url2 = url + add + '&output=' + output + '&ak=' + ak req = urlopen(url2) res = req.read().decode() temp = json.loads(res) return tempdef getlatlon(sd_rs): nrows_sd_rs=sd_rs.nrows for i in range(4,nrows_sd_rs): # for i in range(4, 7): row=sd_rs.row_values(i) print(i,i/nrows_sd_rs) b = (row[11]+row[12]+row[9]).replace('#',' Number ') # The address in the third column print(b) try: lng = getlnglat(b)['result']['location']['lng'] # Get longitude and write lat = getlnglat(b)['result']['location']['lat'] # Get the latitude and write except KeyError as e: lng='' lat='' f_err=open('f_err.txt','a') f_err.write(str(i)+'\t') f_err.close() print(e) print(lng,lat) f_latlon = open('f_latlon.txt', 'a') f_latlon.write(row[0]+'\t'+b+'\t'+str(lng)+'\t'+str(lat)+'\n') f_latlon.close()if __name__=='__main__': # sle_xls_file = 'F:\ Medical big data project \ Jiangsu Province SLE database ( Two follow-up visits were combined ).xlsx' sle_xls_file = "F:\ Medical big data project \ Copy of data \ Jiangsu Province SLE database ( Two follow-up visits were combined ) - copy .xlsx" sle_data_rs = readXLS(sle_xls_file, 1) getlatlon(sle_data_rs)Result display :
This is about python The single factor analysis, linear fitting and geocoding of data analysis are introduced here , More about python For data analysis, please search the previous articles of SDN or continue to browse the relevant articles below. I hope you will support SDN more in the future !