pandas Identification is more like adding identification to the rows and columns of the data matrix
Like a set of data
[[ 0 1 2 3]
[ 4 5 6 7]
[ 8 9 10 11]]
become
 max mean min std
a 0 1 2 3
b 4 5 6 7
c 8 9 10 11
import numpy as np
import pandas as pd
# pandas The main data structure of Series( A one-dimensional ) and DataFrame( matrix )
# commonly Line labels are characteristics A list is a sample
# index/columns=list("abcd") Equivalent to index/columns=['a','b','c','d']
# Series A one-dimensional Automatically add index values
s = pd.Series([1,2,3,64,1,np.nan])
# print(s)
dates = pd.date_range("20201123",periods=6)
df = pd.DataFrame(np.random.randn(6,4),index=dates,columns=['a','b','c','d']) # index Line mark columns Column mark
# DataFrame It's a tabular data structure , It contains an ordered set of columns , Each column can be of a different value type ( The number , character string , Boolean value, etc ).
# DataFrame There are both row and column indexes , It can be seen by Series It's a big dictionary .
x = pd.DataFrame(np.arange(9).reshape((3,3)),
index = list("abc"),
columns = ['qwe','asd','zxc'])
# obj.reindex Sort the data according to the new index sequence
x2 = x.reindex(columns=['asd','qwe','zxc'])
# obj.drop() Return obj The result after deleting a row , The original object does not change ( Use inplace=True You can modify the original object ),axis=1, Act on columns
# Another generation df Methods DataFrame There's a dictionary in it
df2 = pd.DataFrame({"a":1,
"b":pd.Timestamp("20201123"),
'c':np.array([3]*3,dtype='int32'),
'd':['word','word','text']})
# When generated in this way , Dictionary key The value is the column index , Line mark is 0~n
# This method can treat the data of each column specially
print(df2.dtypes) # You can view the data type of each column
print(df2.index) # All lines are marked
print(df2.columns) # All column labels
print(df2.values) # all values value
print(df2.describe()) # Very useful , Describe data variance Average Sum up, etc
print(df2.T) # Be similar to numpy, Flip the data
print(df2.sort_index(axis=1,ascending=False)) # By column of data (axis=1) The reverse (ascending=False) Output
print(df2.sort_values(by="d")) # Sort the values of the data and output
# Two data The addition of is a union operation , Missing value occurs nan, have access to add function , among fill_value The value of is right add() The values in the
# add Add sub Subtraction div division floordiv to be divisible by mul Multiplication pow Power
# apply Apply functions to rows or columns
f = lambda x: x.max() - x.min()
frame.apply(f,axis=1)
# apply The function of is not necessarily scalar, but can also be multivalued Series
def f(x):
return pd.Series([x.max(),x.min()], index=(['max','min']))
frame.apply(f,axis=1)
# applymap Element by element
f = lambda x: x+1
frame.applymap(f)
# x[:2] Row selection
# Convey a single element or a list to [] Selectable column eg:x['qwe']
# How to find data
dates = pd.date_range("20201123",periods=6)
df = pd.DataFrame(np.arange(24).reshape((6,4)),index=dates,columns=['a','b','c','d'])
# The following two methods can select data You can also use slices to select specific data
print(df)
print(df['a'])
print(df["20201123":"20201125"])
x.loc['b',['qwe','zxc']]
# loc and iloc You can also select slices
x.iloc[0:2,:]
# adopt is_unique To see if there are duplicate labels
f = pd.DataFrame(np.random.randn(3,3),columns=list('aab'))
print(f.columns.is_unique)
f['a']
# It can also be used loc Find accurately
# This method inputs specific row and column values
print(df.loc["20201125"]) # 20201125 Data in this row
print(df.loc[:,['a','b']]) # a b Two columns of all data
print(df.loc[["20201126","20201128"],['b','c']]) # "20201126","20201128" These two lines bc Column data
# select by position : iloc The input is the index value
print(df.iloc[1:3,[1,3,2]]) # The front line is Followed by columns You can slice or specify the index value
# Filter by conditions
print(df[df["a"] < 8]) # print(df[df.a < 8])
# Sort sort_index ,ascending=False Descending order , All by default nan All in the tail
frame = pd.DataFrame(np.arange(16).reshape((4,4)),
index=list('bdac'),
columns = list('2415')
)
frame["6"] = [np.nan,4,np.nan,5]
frame.sort_index(ascending=False)
# sort_values Arrange a column of data adopt by List out Make the same changes in other columns
f = pd.DataFrame({"a":[4,2,1],"b":[1,-1,4]})
f.sort_values(by='b')
# Statistical description
# idxmax idxmin Return max and min Line mark of
# argmax argmin Return series Row and column marks
# count Not nan Number of values
# describe Summary statistical list
# obj.unique() give obj The only value of
# value_counts() Calculate the number of occurrences of duplicate values , Can pass apply take pd.value_counts Incoming check Dataframe Number of repetitions in
data = pd.DataFrame({'a':[1,-1,4,2,2],'b':[1,3,4,-1,1]})
data.apply(pd.value_counts).fillna(0) # fillna(0) take nan Value is replaced by 0
# isin() Find the existence status of data Return ture/false
data = list('sacdasdad')
obj = pd.Series(data)
mas = obj.isin(['a','s'])
obj[mas]
# pd Modify the data value , Increase the data value Can pass loc( label ) and iloc( Index value ) modify
df.loc["20201128","A"] = 122
df.iloc[2,2] = 10
# According to the condition
df.B[df.C>4] = 0
# Add a new column
df["F"] = 0
df["G"] = pd.Series([2,3,4,1,5,1],index=pd.date_range("20201126",periods=6)) # adopt Series add to , It has to be index identical
# Handling of missing values
# The following three functions directly replace the original data if you want the effect , Add parameters inplace=Ture
# dropna() After removing a row or column return Changed list
print(df.dropna(
axis=0, # axis=1( Column )
how="any" # any As long as a line contains nan Just remove all A line is all nan Get rid of
))
# fillna() take nan Replace with other values
print(df.fillna(value=0))
# isnull() Judge whether it exists nan return One Ture or False Matrix
print(df.isnull())
# Matrix concatenation concatenating Abbreviation (concat)
df1 = pd.DataFrame(np.zeros((3,4)),columns=["a","b",'c','d'])
df2 = pd.DataFrame(np.ones((3,4)),columns=["a","b",'c','d'])
df3 = pd.DataFrame(np.ones((3,4))*2,index=[2,3,4],columns=["c","d",'e','f'])
# If not ignore_index,dataframe The row mark of is the same as the original , The result is (012301230123)
res = pd.concat([df1,df2],axis=0,ignore_index=True)
# If you use it directly concat, When merging rows and columns of different labels , One has one without time , Which one doesn't work nan fill
# Add parameters join The default is ‘outer’, also 'inner' Only show both ( intersection )
res = pd.concat([df3,df2],axis=0,ignore_index=True,join="inner")
# Parameters axis=1, Horizontal merger , .iloc[[*,*,*]] Specify index value consolidation
res = pd.concat([df2,df3],axis=1).iloc[[1,2,3]]
# append Only vertical consolidation, no horizontal consolidation
res = df1.append(df2.iloc[2],ignore_index=True)
# Two with the same column or row DataFranme Merge
# merging two df bt key/keys. (may be used in databass)
df1 = pd.DataFrame({'key': [1,2,3,4],
"hobby":["eat","sleep","play","happy"]})
df2 = pd.DataFrame({'key': [24,21,4,2],
"age":[21,32,41,24]})
# on Indicates which key As a target, it can be merged into multiple Such as on=['key1','key2']
# how Indicates how to merge
# how The parameters are ['left( With 'left=' Based on )', 'right'( With 'rightt=' Based on ), 'outer( Show all contents , There is no corresponding column nan)', 'inner'( Only show both , The default format )]
# indicator( Default False), Put the merged records in a new column , If indicator="indicator_column", The column label of the newly added column is “indicator_column”
res = pd.merge(left=df1,right=df2,on="key",how="outer",indicator=True)
# merge Merge according to the row standard
df1 = pd.DataFrame({'key': [1,2,12 ,4],
"hobby":["eat","sleep","play","happy"]},
index=[1,2,2,4])
df2 = pd.DataFrame({'key': [24,21,4,2],
"age":[21,32,41,24]},
index=[2,3,4,5])
# The basic parameters are similar to those above
# When merging horizontally , When there are the same column labels (overlapping), Can pass suffixes Definition
res = pd.merge(left=df1,right=df2,left_index=True,right_index=True,how="inner",suffixes=["_boy","_girl"])
print(res)
# Import export file csv excel json pickle
data = pd.read_excel("path") # Import files
data.pd.to_excel("path") # export file
# pandas Make a picture Directly in Serious or DataFrame Back plus ".plot" This is a line chart Other graphics , In Canada ".plot.scatter" Parameters and plt equally
data = pd.DataFrame(np.random.randn(1000,4),
index=np.arange(1000),
columns=list("abcd"))
data = data.cumsum()
ax = data.plot.scatter(x="b",y="a",label="111")
data.plot.scatter(x="b",y="c",ax=ax,label="222",color="red")
plt.show()
20201128
import numpy as np
import pandas as pd
import matplotlib.pyplot as plt
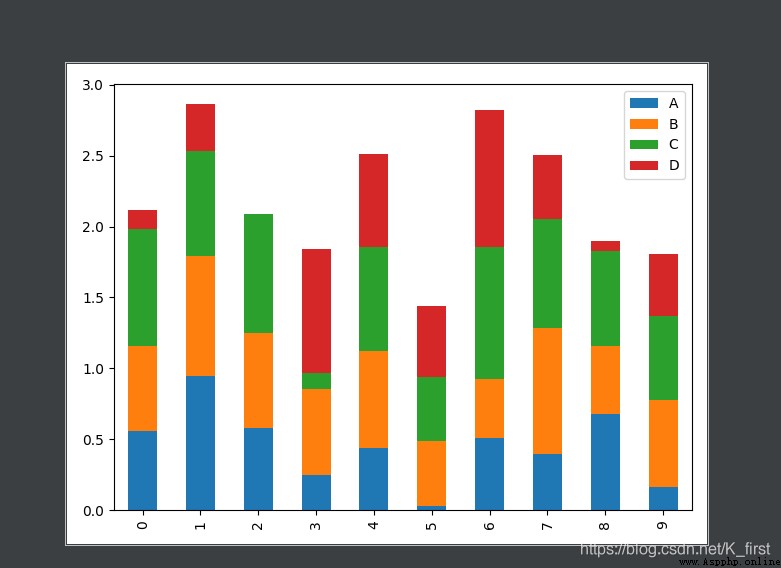
df = pd.DataFrame(np.random.rand(10,4),columns=list("ABCD"))
# stacked Overlay
df.plot.bar(stacked=True)
plt.show()
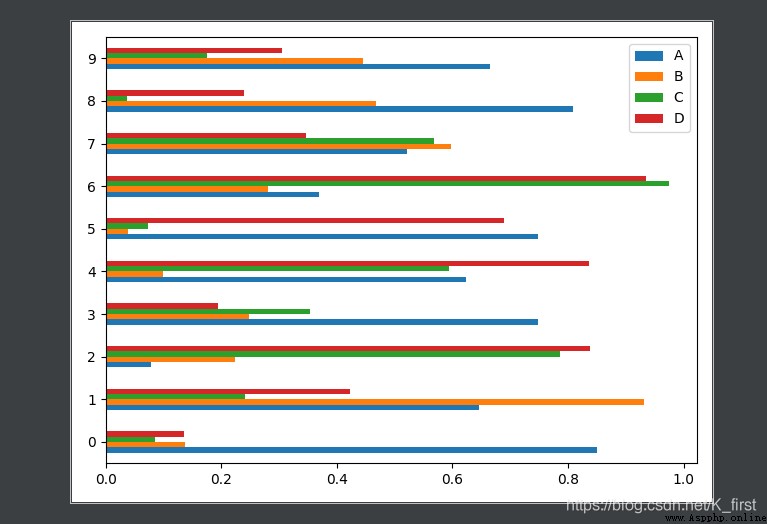
# barh Horizontal bar chart
df.plot.barh()
plt.show()