Introduce a new drawing artifact :sviewgui, It is based on PyQt Of GUI, be used for csv File or Pandas Of DataFrame Data visualization . Like this article, remember to collect 、 Focus on 、 give the thumbs-up .
notes : Technical communication 、 Data acquisition , See you at the end of the article
this GUI be based on matplotlib, You can visualize your... In many ways csv file . The main features :
Ⅰ Scatter plot 、 Line graph 、 Density map 、 Histogram and boxplot types ;
Ⅱ Tag size 、 Line width 、 Histogram of bin Number 、 Color map settings ( come from cmocean);
Ⅲ Save the diagram as editable PDF;
Ⅳ The code for drawing graphics is available , So that it can be in sviewgui Reuse and modify ;
Project address :https://github.com/SojiroFukuda/sview-gui
The usage of this package is super simple , There is only one way :buildGUI(). This method can pass in zero or one parameter . You can use csv The file path of the file is used as a parameter , Or use pandas Of DataFrame Object as parameter . Similar code is written as follows :
# The first form
import sviewgui.sview as sv
sv.buildGUI()
# The second form
import sviewgui.sview as sv
FILE_PATH = "User/Documents/yourdata.csv"
sv.buildGUI(FILE_PATH)
# The third form
import sviewgui.sview as sv
import pandas as pd
FILE_PATH = "User/Documents/yourdata.csv"
df = pd.read_csv(FILE_PATH)
sv.buildGUI(df)
Above code , Just help the driver open this GuI Visual interface .
Last but not least , Because this library is based on matplotlib Visual , therefore seaborn Style also applies here , because seaborn Is based on matplotlib Visual .
There are quite a lot of dependent libraries in this library , Therefore, you can directly use the following line of code to install sviewgui library .
pip install sviewgui -i https://pypi.tuna.tsinghua.edu.cn/simple/ --ignore-installed
This one at the back --ignore-installed, I didn't add it at first , But there was an error , The general error is as follows :
ERROR: Cannot uninstall 'certifi'. It is a distutils installed project and thus we cannot accurately determine which files belong to it which would lead to only a partial uninstall.
Until you add this , Never mind why , Because I don't know !
Above, I introduced 3 Kind open GUI Graphical interface window code , Only the following methods are introduced here :
import sviewgui.sview as svsv.buildGUI()
The screenshot is as follows :
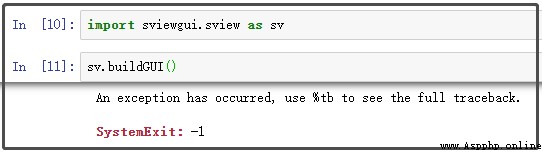
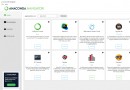
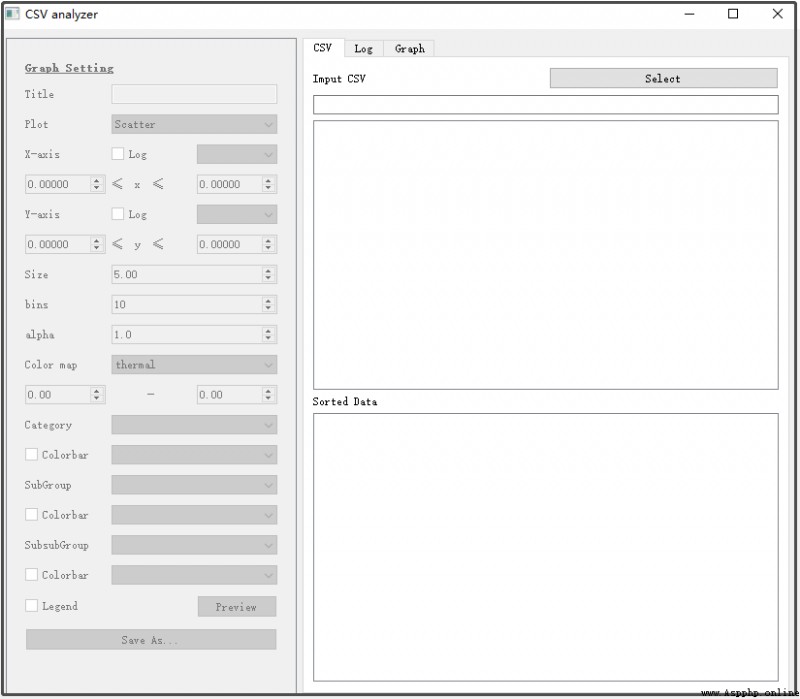
When you enter the above code on the command line , Will drive the background to open this graphical interface window , The initialization state is roughly like this :
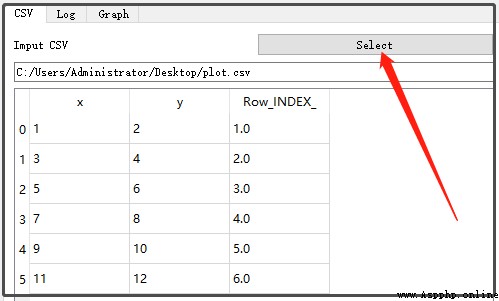
Click on select, You can select a data source :
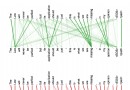
Then we can click on the left menu bar , Generate corresponding graphics . But one thing , It doesn't seem to support Chinese !!!
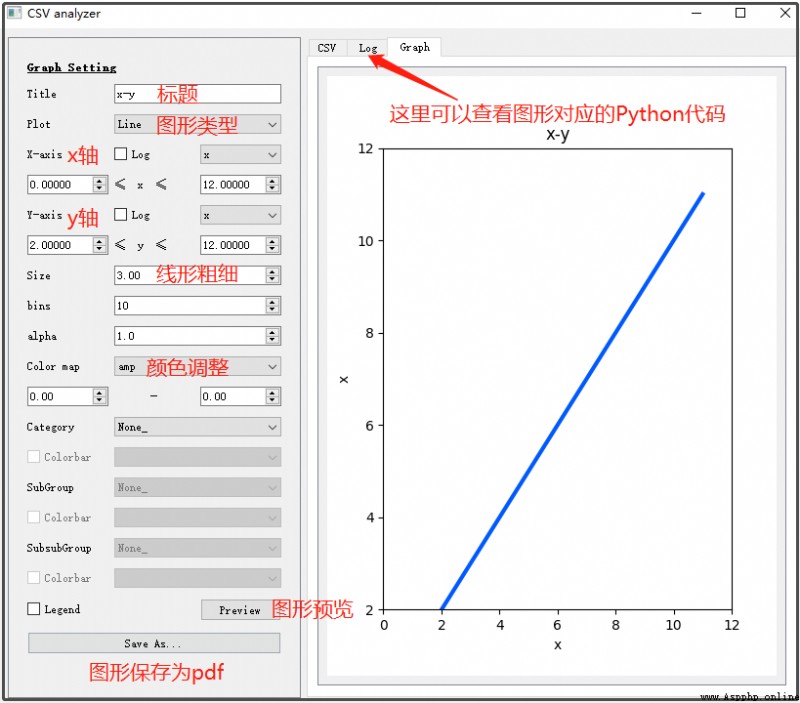
If you think this is not enough to perfect the graphics you want , You can copy the corresponding Python Code , Just modify it .
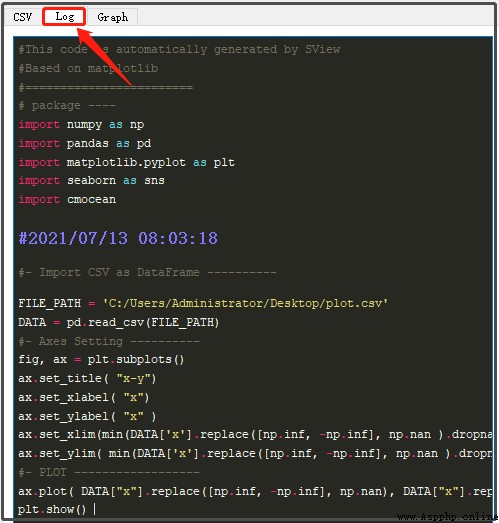
then , You take the following code , Simple modification , You can generate beautiful Matplotlib The graphics are .
import numpy as np
import pandas as pd
import matplotlib.pyplot as plt
import seaborn as sns
import cmocean
#2021/07/13 08:03:18
#- Import CSV as DataFrame ----------
FILE_PATH = 'C:/Users/Administrator/Desktop/plot.csv'
DATA = pd.read_csv(FILE_PATH)
#- Axes Setting ----------
fig, ax = plt.subplots()
ax.set_title( "x-y")
ax.set_xlabel( "x")
ax.set_ylabel( "x" )
ax.set_xlim(min(DATA['x'].replace([np.inf, -np.inf], np.nan ).dropna() ) - abs( min(DATA['x'].replace([np.inf, -np.inf], np.nan ).dropna() )/10), max(DATA['x'].replace([np.inf, -np.inf], np.nan).dropna()) + abs(max(DATA['x'].replace([np.inf, -np.inf], np.nan).dropna())/10) )
ax.set_ylim( min(DATA['x'].replace([np.inf, -np.inf], np.nan ).dropna() ) - abs( min(DATA['x'].replace([np.inf, -np.inf], np.nan ).dropna() )/10), max(DATA['x'].replace([np.inf, -np.inf], np.nan).dropna()) + abs(max(DATA['x'].replace([np.inf, -np.inf], np.nan).dropna())/10) )
#- PLOT ------------------
ax.plot( DATA["x"].replace([np.inf, -np.inf], np.nan), DATA["x"].replace([np.inf, -np.inf], np.nan), linewidth = 3.0, alpha =1.0, color = "#005AFF" )
plt.show()
At present, a technical exchange group has been opened , Group friends have exceeded 3000 people , The best way to add notes is : source + Interest direction , Easy to find like-minded friends
The way ①、 Send the following picture to wechat , Long press recognition , The background to reply : Add group ;
The way ②、 Add microsignals :dkl88191, remarks : come from CSDN
The way ③、 WeChat search official account :Python Learning and data mining , The background to reply : Add group