Previous article Python Draw histogram Matplotlib Pyplot figure bar legend gca text How to use Python Draw histogram , But in practical application, it is necessary to draw line graph on the basis of histogram . For example, in the test report , You can use the graph to reflect the operation of the test case , Histograms can reflect test cases pass How many , How many failures , If you want to reflect pass rate trend , You can use a line chart , This article describes how to draw multiple graphs , Finally, it is applied to draw histogram and line graph on the same graph .
Summary :
plt.figure The function of is to define a large drawing , You can set the size of the drawing 、 Resolution, etc .
for example :
Initialize a canvas
fig = plt.figure(figsize=(7,10),dpi=100)
Directly in the currently active axes Draw above , Attention is currently active
plt.plot() or plt.bar()
Now let's see subplot and subplots , The difference between the two is suplots How many drawings have been specified , therefore ax Ready in advance , and subplot Draw once every time a function is called , Is not specified .
subplot Function is to add a subgraph at a specified position to the current drawing board .
matplotlib.pyplot.subplot(*args, **kwargs)
Function signature :
subplot(nrows, ncols, index, **kwargs) The values in brackets indicate the number of rows in turn 、 Number of columns 、 Number one
subplot(pos, **kwargs)subplot(ax)I didn't use this successfully
If you need to customize the drawing board size , Use subplot This function needs to define a custom size palette first , because subplot Function cannot change the size and resolution of the palette ; So we have to go through fig = plt.figure(figsize=(12, 4), dpi=200) To define the settings related to the sketchpad ; Otherwise, press the default size of the drawing board ; meanwhile , The following convenient operation of this function is to directly use plt, Get the currently active layer .
for example : add to 4 Subtext
No custom Sketchpad , So you add subgraphs on the default size palette .
plt.subplot(221) Medium 221 Indicates that the subgraph area is divided into 2 That's ok 2 Column , Take the first subgraph region . The sub area number is from the upper left corner 1 Start , The sequence number is incremented to the right .
import matplotlib.pyplot as plt
# equivalent but more general than plt.subplot(221)
ax1 = plt.subplot(2, 2, 1)
# add a subplot with no frame
ax2 = plt.subplot(222, frameon=False)
# add a polar subplot
plt.subplot(223, projection='polar')
# add a red subplot that shares the x-axis with ax1
plt.subplot(224, sharex=ax1, facecolor='red')
plt.show()
effect :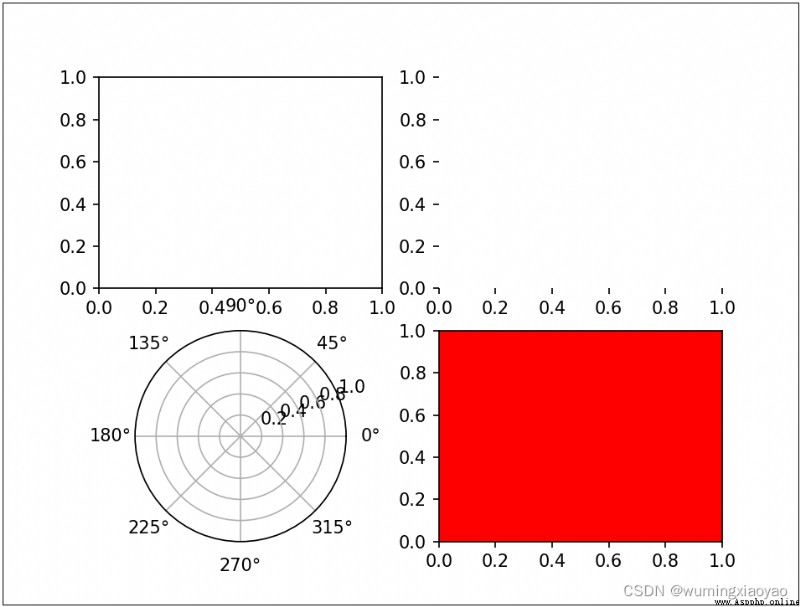
subplots The main function is to create a drawing board and a series of subgraphs .
matplotlib.pyplot.subplots(nrows=1, ncols=1, sharex=False, sharey=False, squeeze=True, subplot_kw=None, gridspec_kw=None, **fig_kw)
This function returns two variables , One is Figure example , the other one AxesSubplot example .Figure Represents the entire image, that is, the entire container of the drawing board ,AxesSubplot Represents the coordinate axis and the subgraph drawn , Obtain the required sub region by subscript .
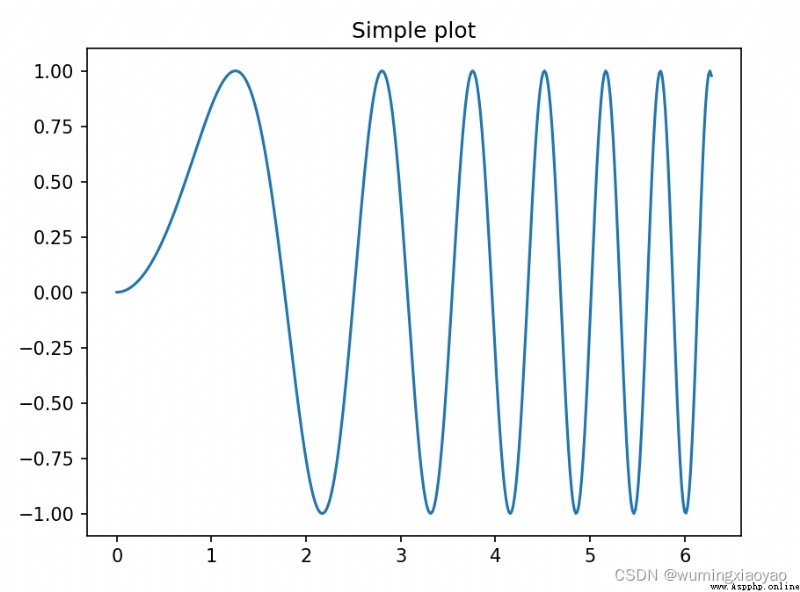
example 1: There is only... In a drawing board 1 Subtext
plt.subplots() Default 1 That's ok 1 Column
 import numpy as np
import matplotlib.pyplot as plt
# First create some toy data:
x = np.linspace(0, 2*np.pi, 400)
y = np.sin(x**2)
# Creates just a figure and only one subplot
fig, ax = plt.subplots()
ax.plot(x, y)
ax.set_title('Simple plot')
plt.show()
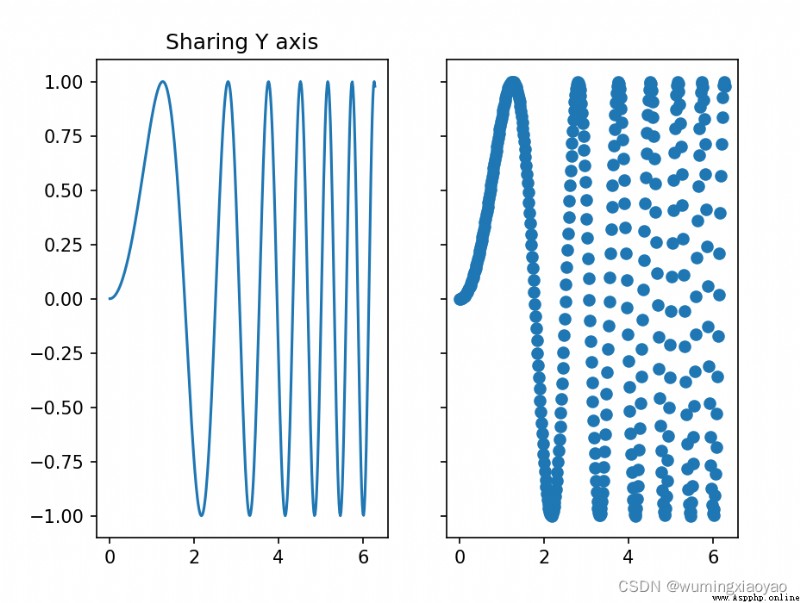
example 2: There is only... In a drawing board 2 Subtext
plt.subplots(1, 2)1 That's ok 2 Column
 import numpy as np
import matplotlib.pyplot as plt
# First create some toy data:
x = np.linspace(0, 2*np.pi, 400)
y = np.sin(x**2)
# Creates two subplots and unpacks the output array immediately
f, (ax1, ax2) = plt.subplots(1, 2, sharey=True)
ax1.plot(x, y)
ax1.set_title('Sharing Y axis')
ax2.scatter(x, y)
plt.show()
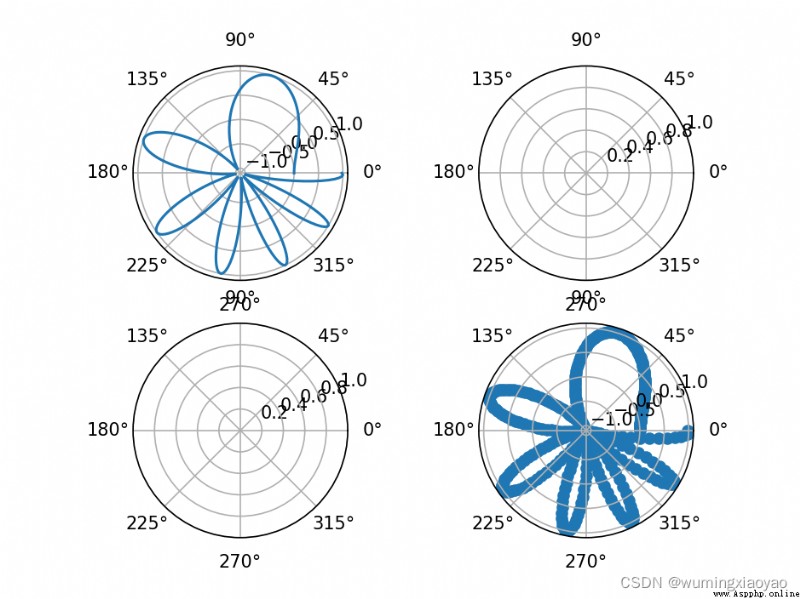
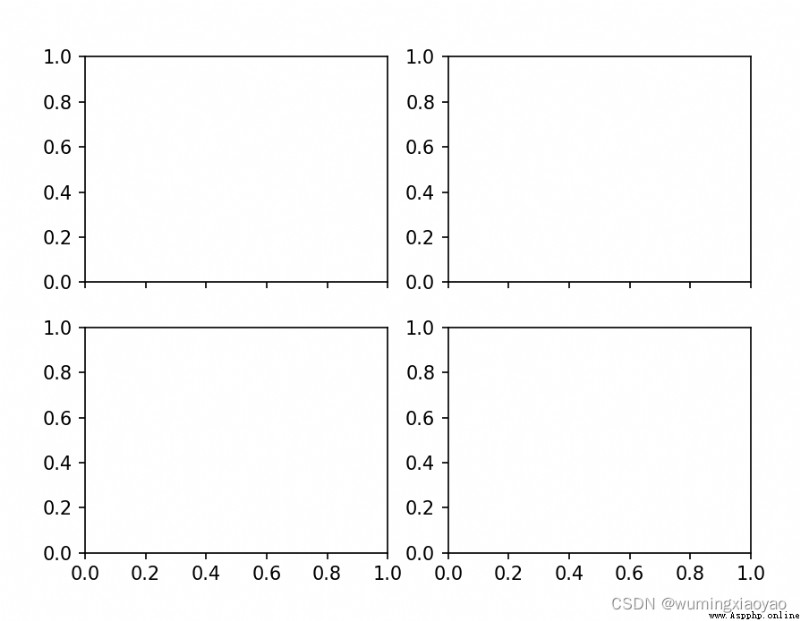
example 3: There is only... In a drawing board 4 Subtext
plt.subplots(2, 2)2 That's ok 2 Column
Query subgraphs by indexing :
axes[0, 0] Position of the first figure
axes[0, 1] The second figure is in position
axes[1, 0] Position of the third figure
axes[1, 1] Position of the fourth figure
 import numpy as np
import matplotlib.pyplot as plt
# First create some toy data:
x = np.linspace(0, 2*np.pi, 400)
y = np.sin(x**2)
# Creates four polar axes, and accesses them through the returned array
fig, axes = plt.subplots(2, 2, subplot_kw=dict(polar=True))
axes[0, 0].plot(x, y)
axes[1, 1].scatter(x, y)
plt.show()
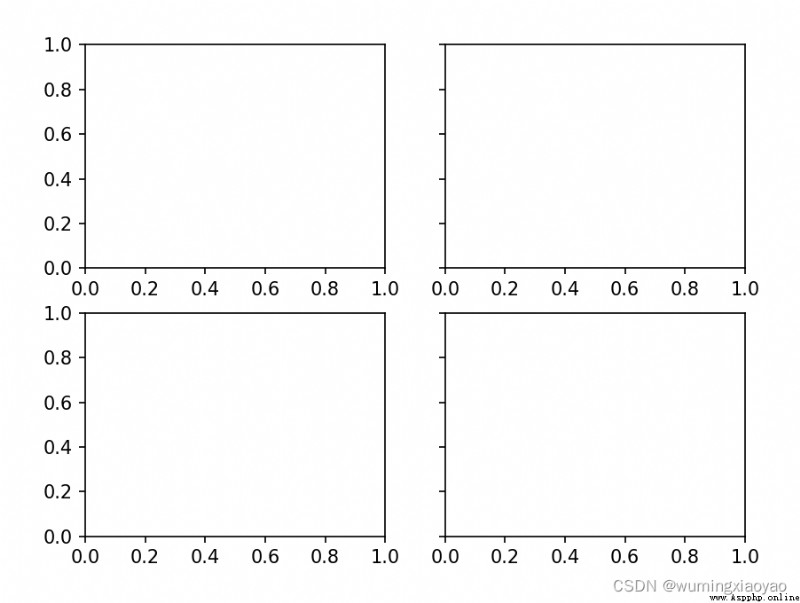
example 4: Sub graph sharing X Axis
sharex=‘col’
 import numpy as np
import matplotlib.pyplot as plt
# Share a X axis with each column of subplots
plt.subplots(2, 2, sharex='col')
plt.show()
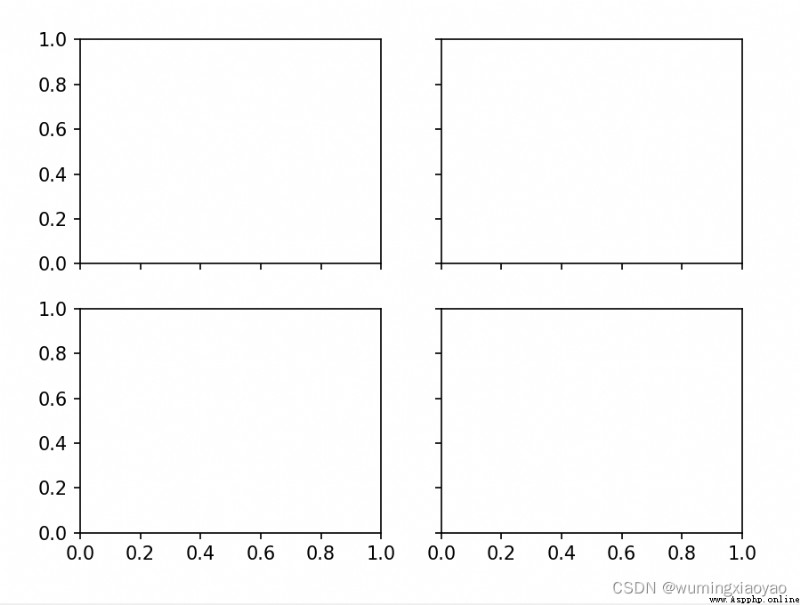
example 5: Sub graph sharing Y Axis
sharey=‘row’
 import numpy as np
import matplotlib.pyplot as plt
# Share a X axis with each column of subplots
plt.subplots(2, 2, sharey='row')
plt.show()
example 6: Sub graph sharing X and Y Axis
sharex=‘all’, sharey=‘all’
 import numpy as np
import matplotlib.pyplot as plt
# Share a X axis with each column of subplots
plt.subplots(2, 2, sharex='all', sharey='all')
# Note that this is the same as
# plt.subplots(2, 2, sharex=True, sharey=True)
plt.show()
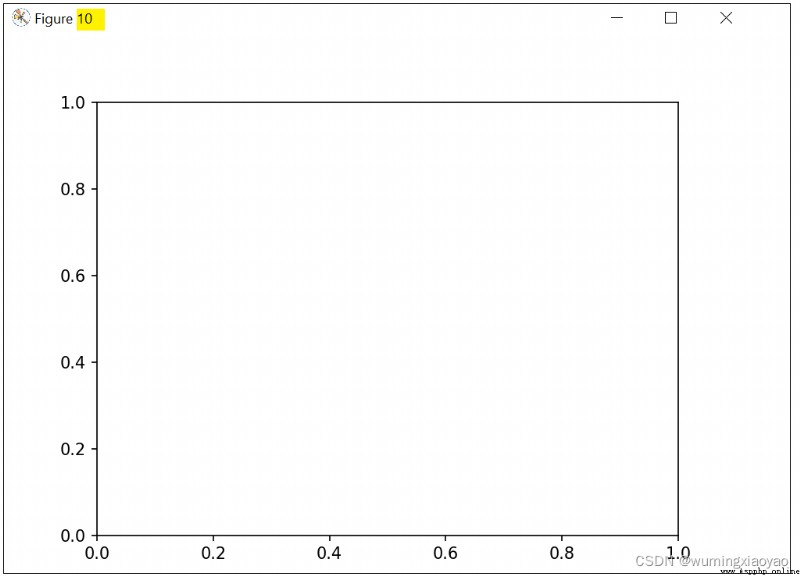
example 7: Create numbered drawings
The number is 10 The drawing board of , If the number already exists , Then delete the number .
 import numpy as np
import matplotlib.pyplot as plt
# Creates figure number 10 with a single subplot
# and clears it if it already exists.
fig, ax=plt.subplots(num=10, clear=True)
plt.show()
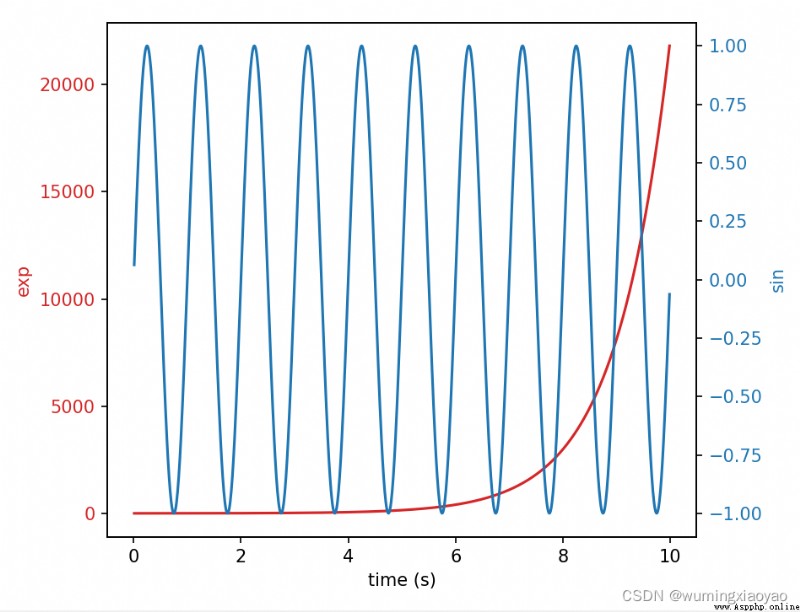
I understand subplots function , Yes twinx Functions are much easier to understand .
twinx Returns a new subgraph and shares the current subgraph X Axis . The new subgraph will cover X Axis ( If the new subgraph X The axis is None Will use the current subgraph X Axis data ), Its Y The axis will be on the right . Empathy twiny The function is shared Y The shaft .
example : We draw a red line graph first , Then draw a blue line subgraph , The blue line subgraphs share the red line subgraphs X The shaft , Then it can be realized in real samples :
fig, ax1 = plt.subplots() Generate a Sketchpad fig, And default to the first subgraph ax1.
ax1.plot(t, data1, color=color) ax1 Draw a line graph in the area of the first subgraph
ax2 = ax1.twinx() Generate a new subgraph ax2 , And share ax1 Of the first subgraph X Axis
ax2.plot(t, data2, color=color) In the new subgraph ax2 Draw a line chart in the area
design sketch :
Code :
 import numpy as np
import matplotlib.pyplot as plt
# Create some mock data
t = np.arange(0.01, 10.0, 0.01)
data1 = np.exp(t)
data2 = np.sin(2 * np.pi * t)
fig, ax1 = plt.subplots()
color = 'tab:red'
ax1.set_xlabel('time (s)')
ax1.set_ylabel('exp', color=color)
ax1.plot(t, data1, color=color)
ax1.tick_params(axis='y', labelcolor=color)
ax2 = ax1.twinx() # instantiate a second axes that shares the same x-axis
color = 'tab:blue'
ax2.set_ylabel('sin', color=color) # we already handled the x-label with ax1
ax2.plot(t, data2, color=color)
ax2.tick_params(axis='y', labelcolor=color)
fig.tight_layout() # otherwise the right y-label is slightly clipped
plt.show()
With the foundation in front , Let's draw a histogram and a line chart . Based on the previous article Python Draw histogram Matplotlib Pyplot figure bar legend gca text Draw a line graph based on the example of histogram .
The application scenario is the test case running result diagram , Histogram description Smoke and Regressin Use cases pass and fail Number , Line diagrams describe the overall use case Pass Rate. hold Mock It can be directly applied by changing the number of , The specific code details will not be introduced in detail , You can refer to article Python Draw histogram Matplotlib Pyplot figure bar legend gca text .
design sketch :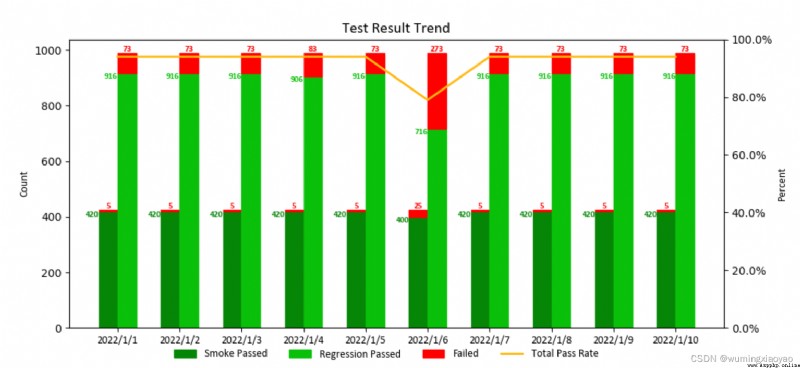
Code :
import matplotlib.pyplot as plt
import matplotlib.font_manager as font_manager
import numpy as np
from matplotlib.ticker import FuncFormatter
def to_percent(num, position):
return str(num) + '%'
def draw_trend_image_test(reg_total_count_pass, reg_total_count_fail, smoke_total_count_pass, smoke_total_count_fail, date_list, image_file_name = 'test_result_trend.png'):
# attributes
bar_width = 0.3
regression_pass_color = '#0ac00a'
smoke_pass_color = '#068606'
font_name = 'Calibri'
label_size = 10
text_size = 8
title_size = 14
# set the color for failure
smoke_fail_color = []
for item in smoke_total_count_fail:
if item > 0:
smoke_fail_color.append("red")
else:
smoke_fail_color.append(smoke_pass_color)
reg_fail_color = []
for item in reg_total_count_fail:
if item > 0:
reg_fail_color.append("red")
else:
reg_fail_color.append(regression_pass_color)
total_pass_rate = [round((s_p+r_p)/(s_p+r_p+s_f+r_f), 2)*100 for s_p, r_p, s_f, r_f in zip(
smoke_total_count_pass, reg_total_count_pass, smoke_total_count_fail, reg_total_count_fail)]
if len(date_list) > 5:
fig, ax1 = plt.subplots(figsize=(10.8, 4.8))
else:
fig, ax1 = plt.subplots()
# draw bar
x = np.arange(len(date_list))
ax1.bar(x - bar_width/2, smoke_total_count_pass, color=smoke_pass_color, edgecolor=smoke_pass_color, width= bar_width, label="Smoke Passed")
ax1.bar(x - bar_width/2, smoke_total_count_fail, color="red", edgecolor=smoke_fail_color, width= bar_width, bottom=smoke_total_count_pass)
ax1.bar(x + bar_width/2, reg_total_count_pass, color=regression_pass_color, edgecolor=regression_pass_color, width= bar_width, label="Regression Passed")
ax1.bar(x + bar_width/2, reg_total_count_fail, color="red", edgecolor=reg_fail_color, width= bar_width, label="Failed", bottom=reg_total_count_pass)
# set title, labels
ax1.set_title("Test Result Trend", fontsize=title_size, fontname=font_name)
ax1.set_xticks(x, date_list,fontsize=label_size, fontname=font_name)
ax1.set_ylabel("Count",fontsize=label_size, fontname=font_name)
# set bar text
for i in x:
if smoke_total_count_fail[i] > 0:
ax1.text(i-bar_width/2, smoke_total_count_fail[i] + smoke_total_count_pass[i], smoke_total_count_fail[i],horizontalalignment = 'center', verticalalignment='bottom',fontsize=text_size,family=font_name,color='red',weight='bold')
ax1.text(i-bar_width, smoke_total_count_pass[i], smoke_total_count_pass[i],horizontalalignment = 'right', verticalalignment='top',fontsize=text_size,family=font_name,color=smoke_pass_color,weight='bold')
ax1.text(i, reg_total_count_pass[i], reg_total_count_pass[i], horizontalalignment = 'right', verticalalignment='top',fontsize=text_size,family=font_name,color=regression_pass_color,weight='bold')
if reg_total_count_fail[i] > 0:
ax1.text(i+ bar_width/2, reg_total_count_fail[i] + reg_total_count_pass[i], reg_total_count_fail[i],horizontalalignment = 'center', verticalalignment='bottom',fontsize=text_size,family=font_name,color='red',weight='bold')
# draw plot
ax2 = ax1.twinx()
ax2.plot(x, total_pass_rate, label='Total Pass Rate',
linewidth=2, color='#FFB90F')
ax2.yaxis.set_major_formatter(FuncFormatter(to_percent))
ax2.set_ylim(0, 100)
ax2.set_ylabel("Percent",fontsize=label_size, fontname=font_name)
# plt.show() # should comment it if save the pic as a file, or the saved pic is blank
# dpi: image resolution, better resolution, bigger image size
legend_font = font_manager.FontProperties(family=font_name, weight='normal',style='normal', size=label_size)
fig.legend(loc="lower center", ncol=4, frameon=False, prop=legend_font)
fig.savefig(image_file_name,dpi = 100)
if __name__ == '__main__':
reg_total_count_pass = [916,916,916,906,916,716,916,916,916,916]
reg_total_count_fail = [73,73,73,83,73,273,73,73,73,73]
smoke_total_count_pass = [420, 420, 420,420, 420, 400,420, 420, 420,420]
smoke_total_count_fail = [5,5,5,5,5,25,5,5,5,5]
date_list = ['2022/1/1', '2022/1/2', '2022/1/3','2022/1/4','2022/1/5', '2022/1/6', '2022/1/7','2022/1/8', '2022/1/9', '2022/1/10']
draw_trend_image_test(reg_total_count_pass, reg_total_count_fail, smoke_total_count_pass, smoke_total_count_fail, date_list)