大家可以關注知乎或微信公眾號的share16,我們也會同步更新此文章.
The mobility of the population is an important driver of the nationwide spread of the novel coronavirus,Many predictive models for assessing the infection rate and spread of infectious viruses are based on human-flow data,Measures such as the closure of the city due to virus infection and the cancellation of Spring Festival activities during the Spring Festival show that restricting population movement is an important way to curb the spread of the virus.
The population migration before the Spring Festival undoubtedly accelerated the spatiotemporal spread of the epidemic,However, the nationwide return of population after the Spring Festival will still bring huge challenges to the prevention and control of the epidemic.可以說,Deeply understand the migration characteristics and laws of population return after the Spring Festival,It will play a very positive role in the prevention and control of this epidemic.數據時間為2019-11-30和2020-02-20,It is the first Spring Festival before the epidemic and the beginning of the epidemic, respectively.
點此下載數據集
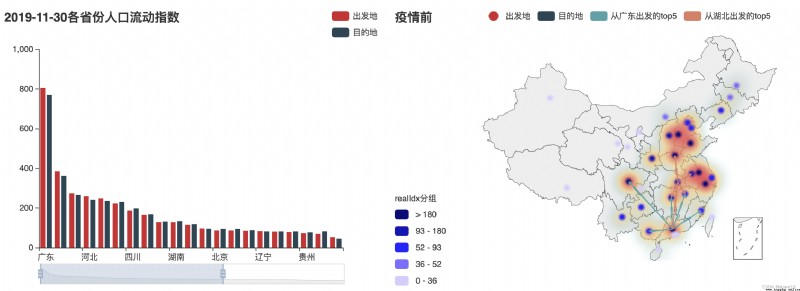
① Population mobility in each province before the epidemic——柱形圖/地圖;The flight map of the top five provinces with the largest flow in Guangdong and Hubei(Guangdong is the province with the largest population flow、Hubei was the first province to lock down the city);
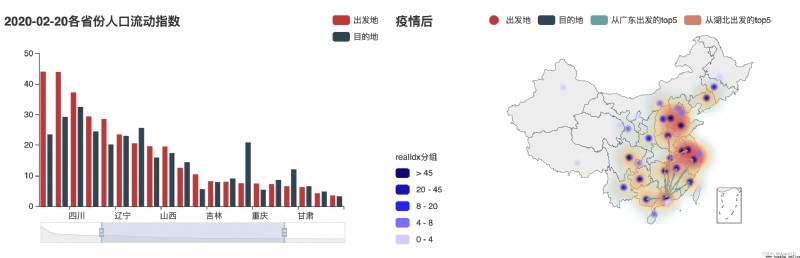
② Population movement in various provinces after the epidemic——柱形圖/地圖;The flight map of the top five provinces with the largest flow in Guangdong and Hubei(Guangdong is the province with the largest population flow、Hubei was the first province to lock down the city);
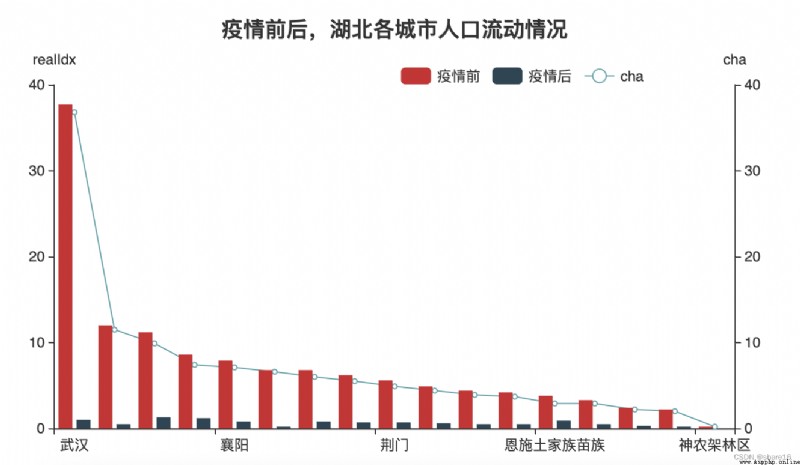
③ Population flow in Hubei cities before and after the epidemic;
import pandas as pd
from pyecharts.charts import *
import pyecharts.options as opts
df1 = pd.read_csv('/XXXXXX/2019-11-30.csv')
df1_1 = df1.groupby(['startProvince']).realIdx.sum().round(1)
df1_2 = df1.groupby(['endProvince']).realIdx.sum().round(1)
df1_3 = pd.merge(df1_1,df1_2,how='left',left_index=True,right_index=True).sort_values('realIdx_x',ascending=False)
df2_1 = df1.groupby(['startProvince','endProvince']).realIdx.sum().round(1).reset_index()
df2_1['r'] = df2_1.groupby(['startProvince'])['realIdx'].rank(method='first',ascending=False)
ls1_city = list(df2_1.query("startProvince in ['廣東'] & startProvince!=endProvince & \
realIdx>0 & r<=6").set_index(['startProvince','endProvince']).index)
ls2_city = list(df2_1.query("startProvince in ['湖北'] & startProvince!=endProvince & \
realIdx>0 & r<=6").set_index(['startProvince','endProvince']).index)
df2 = pd.read_csv('/XXXXXX/2020-02-20.csv')
df3_1 = df2.groupby(['startProvince']).realIdx.sum().round(1)
df3_2 = df2.groupby(['endProvince']).realIdx.sum().round(1)
df3_3 = pd.merge(df3_1,df3_2,how='left',left_index=True,right_index=True).sort_values('realIdx_x',ascending=False)
df4_1 = df2.groupby(['startProvince','endProvince']).realIdx.sum().round(1).reset_index()
df4_1['r'] = df4_1.groupby(['startProvince'])['realIdx'].rank(method='first',ascending=False)
ls3_city = list(df4_1.query("startProvince in ['廣東'] & startProvince!=endProvince & \
realIdx>0 & r<=6").set_index(['startProvince','endProvince']).index)
ls4_city = list(df4_1.query("startProvince in ['湖北'] & startProvince!=endProvince & \
realIdx>0 & r<=6").set_index(['startProvince','endProvince']).index)
hb1 = df1[df1.startProvince=='湖北'].groupby(['startCity']).realIdx.sum()
hb2 = df2[df2.startProvince=='湖北'].groupby(['startCity']).realIdx.sum()
hb = pd.merge(hb1,hb2,left_index=True,right_index=True)
hb['cha'] = hb.realIdx_x-hb.realIdx_y
hb.sort_values('cha',ascending=False,inplace=True)
p1 = Geo()
p1.add_schema(maptype='china',is_roam=False)
p1.add('出發地',list(df1_1.to_dict().items()),type_='effectScatter',symbol_size=5,
label_opts=opts.LabelOpts(is_show=False))
p1.add('目的地',list(df1_2.to_dict().items()),type_='heatmap',
is_large=True,blur_size=16,point_size=16) #It can be set to when the amount of chart data is largeTrue、光暈大小、點的大小
p1.add('from Guangdongtop5',ls1_city,type_='lines',symbol_size=5,label_opts=opts.LabelOpts(is_show=False))
p1.add('from Hubeitop5',ls2_city,type_='lines',symbol_size=5,label_opts=opts.LabelOpts(is_show=False))
p1.set_global_opts(title_opts=opts.TitleOpts('疫情前'),
visualmap_opts=opts.VisualMapOpts(range_text=['realIdx分組'],is_piecewise=True,
pieces=[{
'min':180,'color':'#080177'},
{
'min':93,'max':180,'color':'#1203B3'},
{
'min':52,'max':93,'color':'#2106fa'},
{
'min':36,'max':52,'color':'#7C69FD'},
{
'min':0,'max':36,'color':'#D4CDFE'}]))
p2 = Bar()
p2.add_xaxis(list(df1_3.to_dict()['realIdx_x'].keys()))
p2.add_yaxis('出發地',list(df1_3.to_dict()['realIdx_x'].values()),label_opts=opts.LabelOpts(is_show=False))
p2.add_yaxis('目的地',list(df1_3.to_dict()['realIdx_y'].values()),label_opts=opts.LabelOpts(is_show=False))
p2.set_global_opts(title_opts=opts.TitleOpts('2019-11-30Population mobility index by province'),
legend_opts=opts.LegendOpts(pos_right='right'),datazoom_opts=opts.DataZoomOpts())
p3 = Bar()
p3.add_xaxis(list(df3_3.to_dict()['realIdx_x'].keys()))
p3.add_yaxis('出發地',list(df3_3.to_dict()['realIdx_x'].values()),label_opts=opts.LabelOpts(is_show=False))
p3.add_yaxis('目的地',list(df3_3.to_dict()['realIdx_y'].values()),label_opts=opts.LabelOpts(is_show=False))
p3.set_global_opts(title_opts=opts.TitleOpts('2020-02-20Population mobility index by province'),
legend_opts=opts.LegendOpts(pos_right='right'),datazoom_opts=opts.DataZoomOpts())
p4 = Geo()
p4.add_schema(maptype='china',is_roam=False)
p4.add('出發地',list(df3_1.to_dict().items()),type_='effectScatter',symbol_size=5,
label_opts=opts.LabelOpts(is_show=False))
p4.add('目的地',list(df3_2.to_dict().items()),type_='heatmap',
is_large=True,blur_size=16,point_size=16) #It can be set to when the amount of chart data is largeTrue、光暈大小、點的大小
p4.add('from Guangdongtop5',ls3_city,type_='lines',symbol_size=5,label_opts=opts.LabelOpts(is_show=False))
p4.add('from Hubeitop5',ls4_city,type_='lines',symbol_size=5,label_opts=opts.LabelOpts(is_show=False))
p4.set_global_opts(title_opts=opts.TitleOpts('疫情後'),
visualmap_opts=opts.VisualMapOpts(range_text=['realIdx分組'],is_piecewise=True,
pieces=[{
'min':45,'color':'#080177'},
{
'min':20,'max':45,'color':'#1203B3'},
{
'min':8,'max':20,'color':'#2106fa'},
{
'min':4,'max':8,'color':'#7C69FD'},
{
'min':0,'max':4,'color':'#D4CDFE'}]))
b = Bar()
b.add_xaxis(list(hb.index))
b.add_yaxis('疫情前',list(hb.realIdx_x.round(1)),label_opts=opts.LabelOpts(is_show=False))
b.add_yaxis('疫情後',list(hb.realIdx_y.round(1)),label_opts=opts.LabelOpts(is_show=False))
b.extend_axis(yaxis=opts.AxisOpts(name='cha',position='right'))
b.extend_axis(yaxis=opts.AxisOpts(name='realIdx',position='left'))
l = Line()
l.add_xaxis(list(hb.index))
l.add_yaxis('cha',list(hb.cha.round(1)),yaxis_index=1,label_opts=opts.LabelOpts(is_show=False))
b.overlap(l)
b.set_global_opts(title_opts=opts.TitleOpts('疫情前後,Population mobility in cities in Hubei',pos_left='center'),
legend_opts=opts.LegendOpts(pos_top='10%',pos_right='20%'))
p = Page(layout=Page.DraggablePageLayout)
p.add(p2,p1,p3,p4,b)
p.render('hh.html')
p.render_notebook()
p.save_resize_html(source='hh.html',
cfg_file='/xxxxxx/chart_config.json',
dest='/xxxxxx/chart.html')
''' 市.json:Available for download from the original data source '''
a = pd.read_json('/XXXXXX/市.json',orient='index')
ls = []
for i in range(len(a.loc['features',0])):
m = a.loc['features',0][i]['attributes']
ls.append((m['省'],m['省代碼'],m['市'],m['市代碼']))
pd.DataFrame(ls).head()
謝謝大家