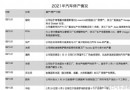
The purpose of writing this article is to record what we have seen and practiced : Today's share is based on SODA In the open data set of the competition , Simple cleaning of all-in-one card data set , Data can be obtained directly SODA Take a look around the official website , The data content is as follows :
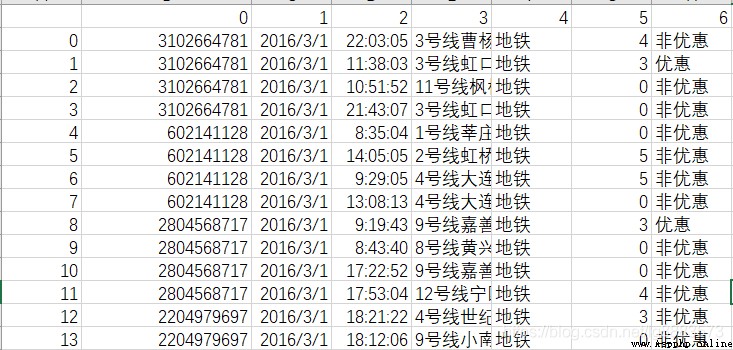
According to the data description :0 Represents the all-in-one card number ,1 Representative date ,2 Represents time ,3 Represents where the card is used ,4 Means of transportation ,5 It's for cost ,6 Represents the type of card . So what are we going to do with this powerful information , First of all, clear the operation goal, and then formulate the cleaning strategy around the goal , by the way , The data is csv Format , I changed it artificially , Replace the number title with ,cardId,date,time,station,way,cost,discount When the text title coexists xls Format , Actually , Not doing so will not affect the next analysis , Because this article will use pandas In fact, reading has been provided excel and csv Methods ;
Well, back to the point , Our homework content , In fact, we know that the normal bus operation process should be : Arrival -> Departure , In this process, there are cardId A set of behaviors sent by the same card , A group of normal consumption behaviors should be : Arrival (cost = 0)-> Departure (cost > 0), Through the interpretation of these behaviors, we can extract a passenger from the data ( One cartoon ), From which stop to which stop , Midway expenses , Travel time and other information . Okay , With the homework goal, we should analyze the data well , The important point of cleaning is to eliminate dirty data , In fact, in many data , There will be the following disturbing information :(1) Only inbound or outbound information , Missing inbound or outbound information ;(2) There is inbound and outbound information, but both consumption results are 0, Or the two consumption results are not 0;
For the above situation, we need to propose dirty data , Because the existence of dirty data will affect our normal data analysis behavior , Of course, dirty data also has its value , For example, we can analyze dirty data , The occurrence factors of dirty data , For the situation (1) The possible situation of dirty data may be because a passenger evades tickets , Or caused by missing brushing , If many passengers are missing information at a certain station , Does that mean that there is a problem with the machine on the site or that there is a special organization near the site .....
All right, man , In the wrong , It's the code above , This paper mainly uses pandas,xlrd,xlwt If a module is missing during operation , Please fill it up by yourself , Ah, no , It is installed by itself :
import pandas as pd
import xlrd
import xlwt# First we need to read the data :
df=pd.read_excel(excel_Path)# If it is csv Just use read_csv# Read the data that the travel mode is subway
df = df[df['way'] == ' metro ']
# Connect the time and date fields , Integrated as datetime Format
df["date"] = df["date"].apply(lambda x:x.strftime("%Y-%m-%d"))
df["time"] = df["time"].apply(lambda x:x.strftime("%H:%M:%S"))
df["time"] = df['date']+' '+df['time']
df["time"] = pd.to_datetime(df["time"])
# Sort according to card number and date
df = df.sort_values(['cardId','time'])
Through the above code, you can basically have an effect :
cardId date time station way cost discount
290 2856179 2016-03-01 2016-03-01 14:59:03 9 Dapuqiao on line metro 0 Non preferential
291 2856179 2016-03-01 2016-03-01 15:13:46 9 Line No. Guilin road metro 3 Discount
746 2903472 2016-03-01 2016-03-01 17:03:36 7 Line Changshou Road metro 0 Non preferential
745 2903472 2016-03-01 2016-03-01 17:20:03 10 Line No. Xintiandi metro 3 Non preferential
298 100661308 2016-03-01 2016-03-01 08:01:28 1 Xinzhuang of line metro 0 Non preferential
go on:
# Add new column
#shift Function is used to move the whole row , A positive number means the whole moves down , Squeeze out the last ; A negative number means the whole moves up , Squeeze out the top
df['id_latter'] = df['cardId'].shift(-1)
df['id_former'] = df['cardId'].shift(1)
df['total_cost'] = df['cost'].shift(-1)
df['des_station'] = df['station'].shift(-1)
df['des_time'] = df['time'].shift(-1)
At this point, some of the preparations we need are basically completed , Now, clean up the dirty data : According to what we said before, we can make a logical judgment :
def judge_vaild(df):
if (df['cost'] == 0) & (df['id_latter'] > 0) & (df['cardId'] == df['id_latter']):
vaild = 1
elif (df['cost'] > 0) & (df['total_cost'] == 0) & (df['cardId'] == df['id_former']):
vaild = 1
else:
vaild = -1
return vaild
Data is logically filtered one by one , And it has been sorted by the door . Logically, it is to judge if the current cost be equal to 0 So in theory, you should enter the site , Corresponding next station cost Should be greater than 0, Then this record should be valid data , If at present cost Greater than 0, In theory, it should be out of the site , Then the last record of this record is cost It should be 0.
Then delete the dirty data :
df.drop(index=(df.loc[(df['vaild'] ==-1)].index),inplace=True)
In fact, so far , The data cleaning is basically completed , I can simply print and output excel:
df['cost_time'] = df.apply(lambda x: x['des_time']-x['time'],axis=1)
df.drop(index=(df.loc[(df['cost']!=0)].index),inplace=True)
df.to_excel(out_path)
df = df[['cardId','station','des_station','total_cost','cost_time','way','discount']]
give the result as follows :
cardId station des_station total_cost cost_time way discount
290 2856179 9 Dapuqiao on line 9 Line No. Guilin road 3.0 00:14:43 metro Non preferential
746 2903472 7 Line Changshou Road 10 Line No. Xintiandi 3.0 00:16:27 metro Non preferential
298 100661308 1 Xinzhuang of line 1 Huangpi South Road 4.0 00:51:36 metro Non preferential
296 100661308 1 Huangpi South Road 1 Xinzhuang of line 4.0 00:33:13 metro Non preferential
In fact, the data analysis results should be displayed with visual charts and the like , How , Not yet get To this skill , Today's sharing is just to see other people's objects and practice it with your own hands . For the specific content and visualization results of this article, you can go to WeChat official account search :Yuan Data analysis of , Of course, the official account has nothing to do with bloggers , But it is the reference object of this article , The practice content and reference code of this article are from an article shared by him .