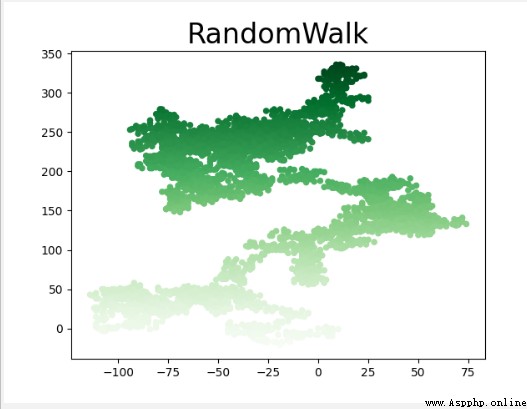
Random walk There are two main implementations step :
(1)python Determine the foothold coordinates after each iteration ( The coordinates are random ), Store the coordinates of the foothold generated each time in the list .
(2) utilize matplotlib The random walk graph is drawn by the scatter plot in .
Random walks have practical uses in reality : The pollen floating on the water droplets moves on the water surface due to the constant pressure of water molecules . The motion of molecules in water droplets is random , Therefore, the movement path of pollen on the water is like a random walk .
(1)python Random walk ( Algorithm module )
# Import first random In the middle of a packet choice function
#choice() Method will implement from the list , Returns a random item in a tuple or string
from random import choice
# Create a for random walk RandomWalk class
class RandomWalk():
""" A class that generates random walk data """
def __init__(self, num_points=5000):# Default iteration 5000 Time
""" Initialize random walk properties """
# A variable that stores the number of random walks
self.num_points = num_points # The default value is 5000
# Two lists store... For each point that the random walk passes through x and y coordinate
# All random walks begin with (0, 0)
self.x_values = [0]
self.y_values = [0]
# To make random decisions , We store all the possible choices in a list , And use... Every time you make a decision choice() To decide which option to use .
# Next , We set the default number of points included in the random walk to 5000, This is big enough to generate interesting patterns , And small enough , This ensures that random walks can be simulated quickly .
# then , We created two for storing x and y List of values , And let every walk start from (0, 0) set out .
# Select the direction of movement
# utilize fill_walk() To generate the points included in the walk , And decide the direction of each walk
def fill_walk(self):# Random walk , Custom travel path
""" Calculate all the points included in the random walk """
# Keep walking , Until the list reaches the specified length
while len(self.x_values)<self.num_points:
# Determine the direction and the distance in this direction
#x Axis direction
x_direction = choice([1, -1])# Direction
x_distance = choice([0, 1, 2, 3, 4])# distance
x_step = x_direction * x_distance# Forward or The distance back
#y Axis direction
y_direction = choice([1, -1]) # Go right for 1 Left for -1
y_distance = choice([0, 1, 2, 3, 4]) # Standard number of forward steps 0-4 Step
y_step = y_direction * y_distance
# Refuse to step in place
if x_step == 0 and y_step == 0:
continue
# Calculate the... Of the next point x and y value self.x_values[-1] # Take the last number every time
next_x = self.x_values[-1] + x_step
next_y = self.y_values[-1] + y_step
# Record every coordinate of the movement
self.x_values.append(next_x)# Add entry x Axis coordinate position
self.y_values.append(next_y)# Add entry y Axis coordinate position
(2) Visualize the random walk results
# Draw a random walk diagram
# Create a RandomWalk example , And draw the points it contains
def show_RandomWalk():
rw = RandomWalk(5000) # New instantiation iteration 5000 Time
rw.fill_walk()
# Start to draw a walk map ( Before drawing , The walk of all points has been completed )
# Use color mapping
plt.scatter(rw.x_values,rw.y_values,c=rw.y_values,cmap=plt.cm.Greens,s=20)
plt.show()
【 Project development 】:
Simulate multiple random walks
【 Logical thinking 】: Using state variables , Put all the code in one while In the constant true cycle , adopt break end while loop , Decide whether the random walk continues .
def show_continue():
# As long as the program is active , Just keep simulating random walk Random walk for plotting a scatter plot
while True:# Adopt constant true cycle
# Create a RandomWalk example , And draw the points it contains
rw = RandomWalk()
# Random walk to determine the foothold
rw.fill_walk()
# Start drawing
# Set the size of the drawing window function figure() Used to specify the width of the chart 、 Height 、 Resolution and background color . You need to give parameters figsize Specify a tuple , towards matplotlib Indicate the size of the drawing window , In inches .
plt.figure(dpi=128,figsize=(10, 6))
#figsize Parameters Set window size Dimension form shall be tuple form ( Long , wide ) Pass parameters
#dpi Parameters Set the image resolution
# Generate a list of numbers , It contains the same number of numbers as the stroll .
# So that you can use it later to set the color of each walk point , To show the order of the drawn points .
point_numbers = list(range(rw.num_points))
# mapping And display the sequence of drawing points
plt.scatter(rw.x_values, rw.y_values,c=point_numbers,cmap=plt.cm.Blues,s=15,edgecolor="none")
# prominent ( mark ) Start and end Emphasis symbol
plt.scatter(0, 0, c='green', edgecolors='none', s=100) # The starting point
plt.scatter(rw.x_values[-1], rw.y_values[-1], c='red', edgecolors='none', s=100) # End
# Hide axis
# Hide bilateral axes
plt.axis('off')
# Hide single axis invisible
# plt.gca().get_xaxis().set_visible(False) #x Axis
# plt.gca().get_yaxis().set_visible(False)#y Axis
# Set the value range of each axis Set the axis range
# plt.axis([0, 1100, 0, 1100000])
# Show
plt.show()
# Ask if you want to continue
keep_running = input("Make another walk? (y/n): ")
if keep_running == 'n':# Exit loop
break