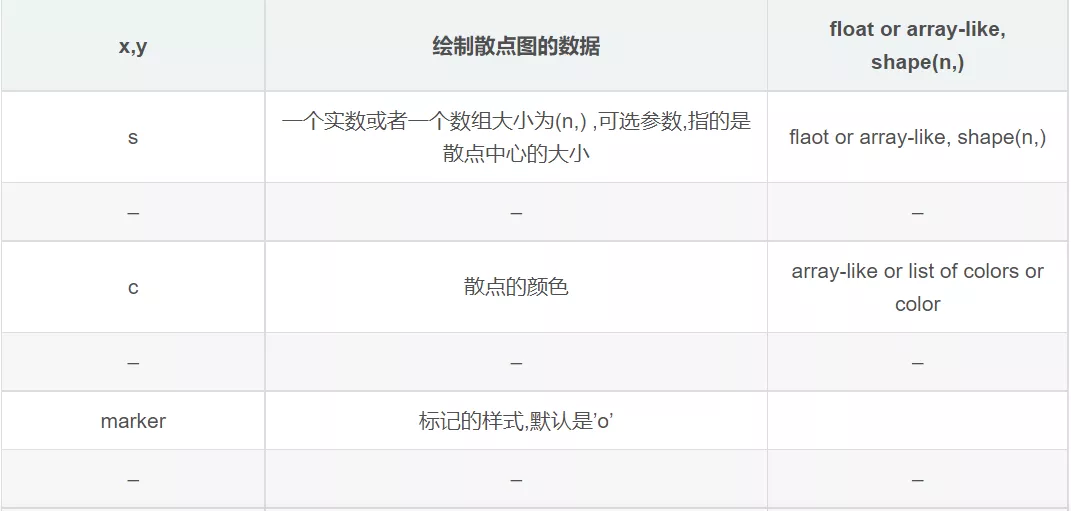
Parameters s
Parameters marker
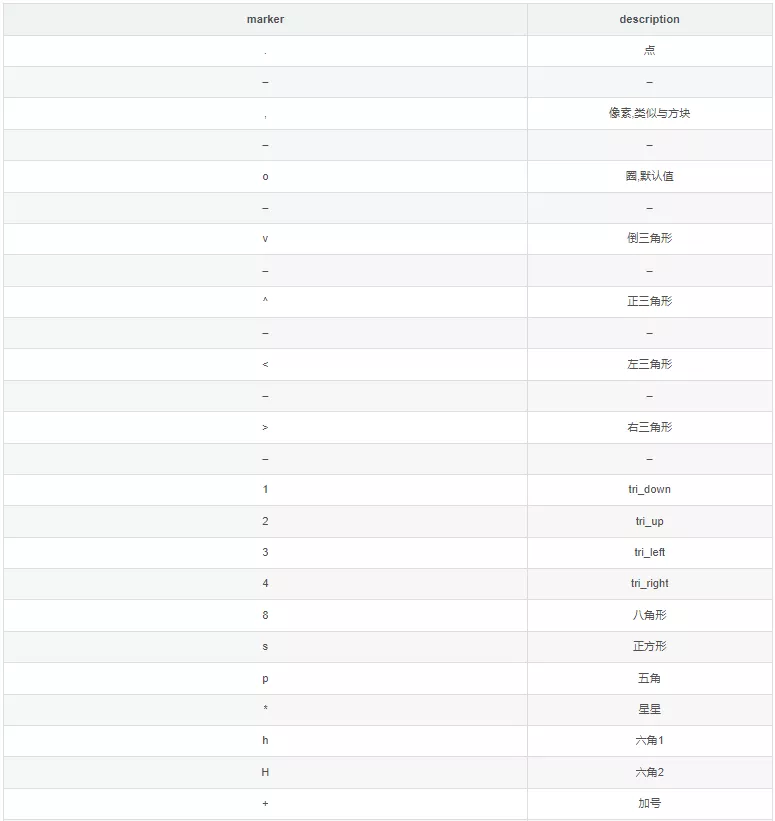
marker attribute
Parameters cmap
vmin,vmax,norm Scatter brightness setting , alpha transparency
usage :
matplotlib.pyplot.scatter(x, y, s=None, c=None, marker=None, cmap=None, norm=None, vmin=None, vmax=None, alpha=None, linewidths=None, *, edgecolors=None, plotnonfinite=False, data=None, **kwargs)Parameter Introduction :

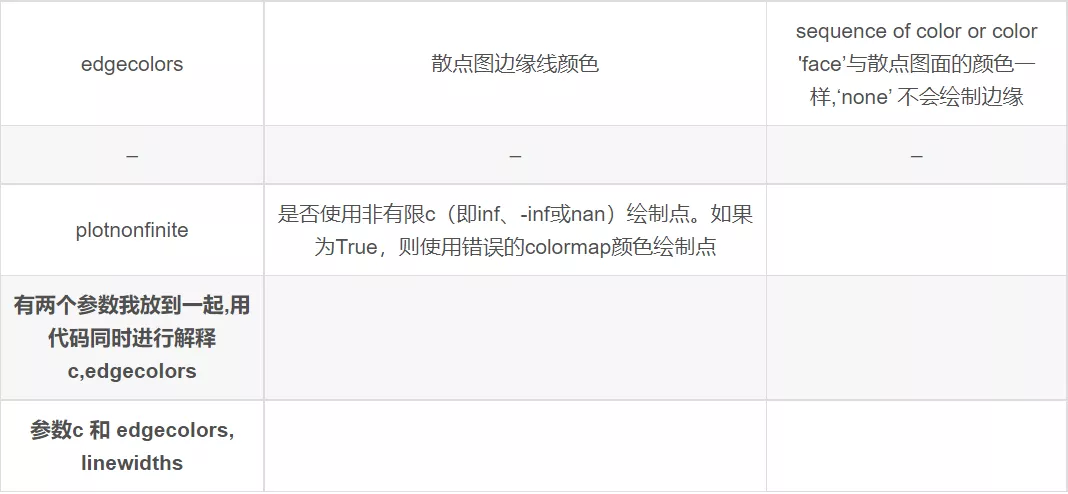
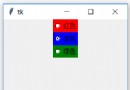
import matplotlib.pyplot as plta = [1, 2, 3, 4, 5]b = [6, 7, 8, 9, 10]# To show c and edgecolors I will linewidths Increase to 15plt.scatter(a, b, linewidths=15,c='red',edgecolors=['black', 'green','cyan','lightgreen'])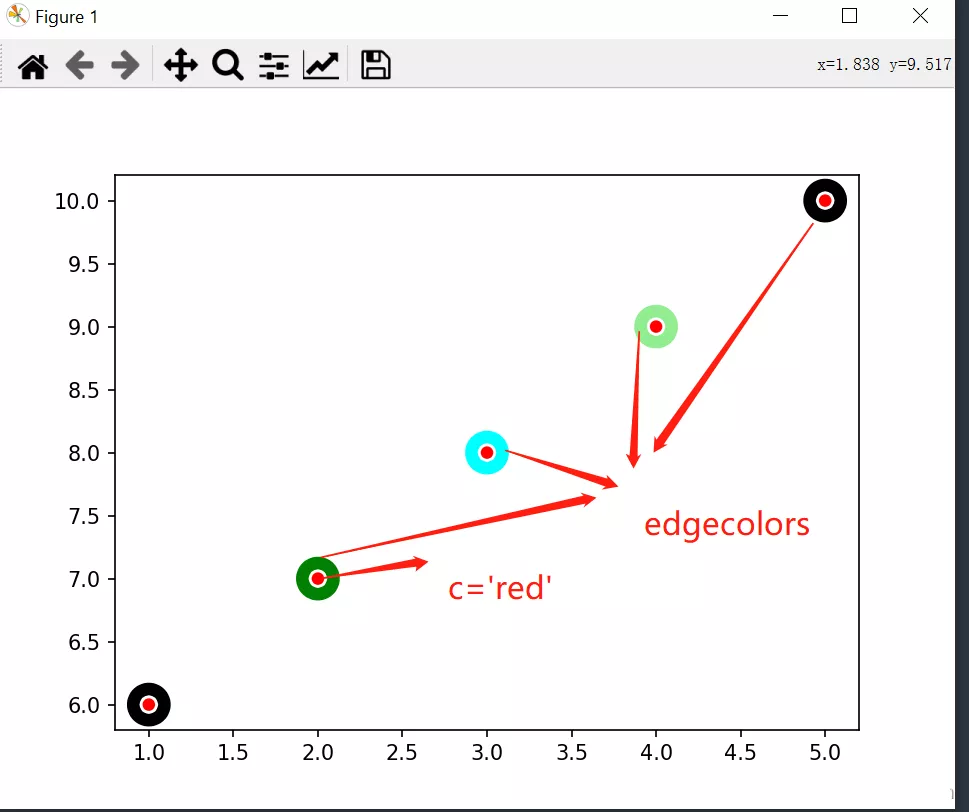
import matplotlib.pyplot as plt%matplotlib inlineplt.figure(figsize=(12,6))plt.rcParams['font.family'] = 'SimHei'a = [1, 2, 3, 4, 5]b = [6, 7, 8, 9, 10]plt.subplot(121)plt.title(' Don't add s')plt.scatter(a,b,c='red',linewidths=6)plt.subplot(122)plt.title(' add to s,s=1.5')plt.scatter(a,b,c='red',s=1.5,linewidths=6)plt.show()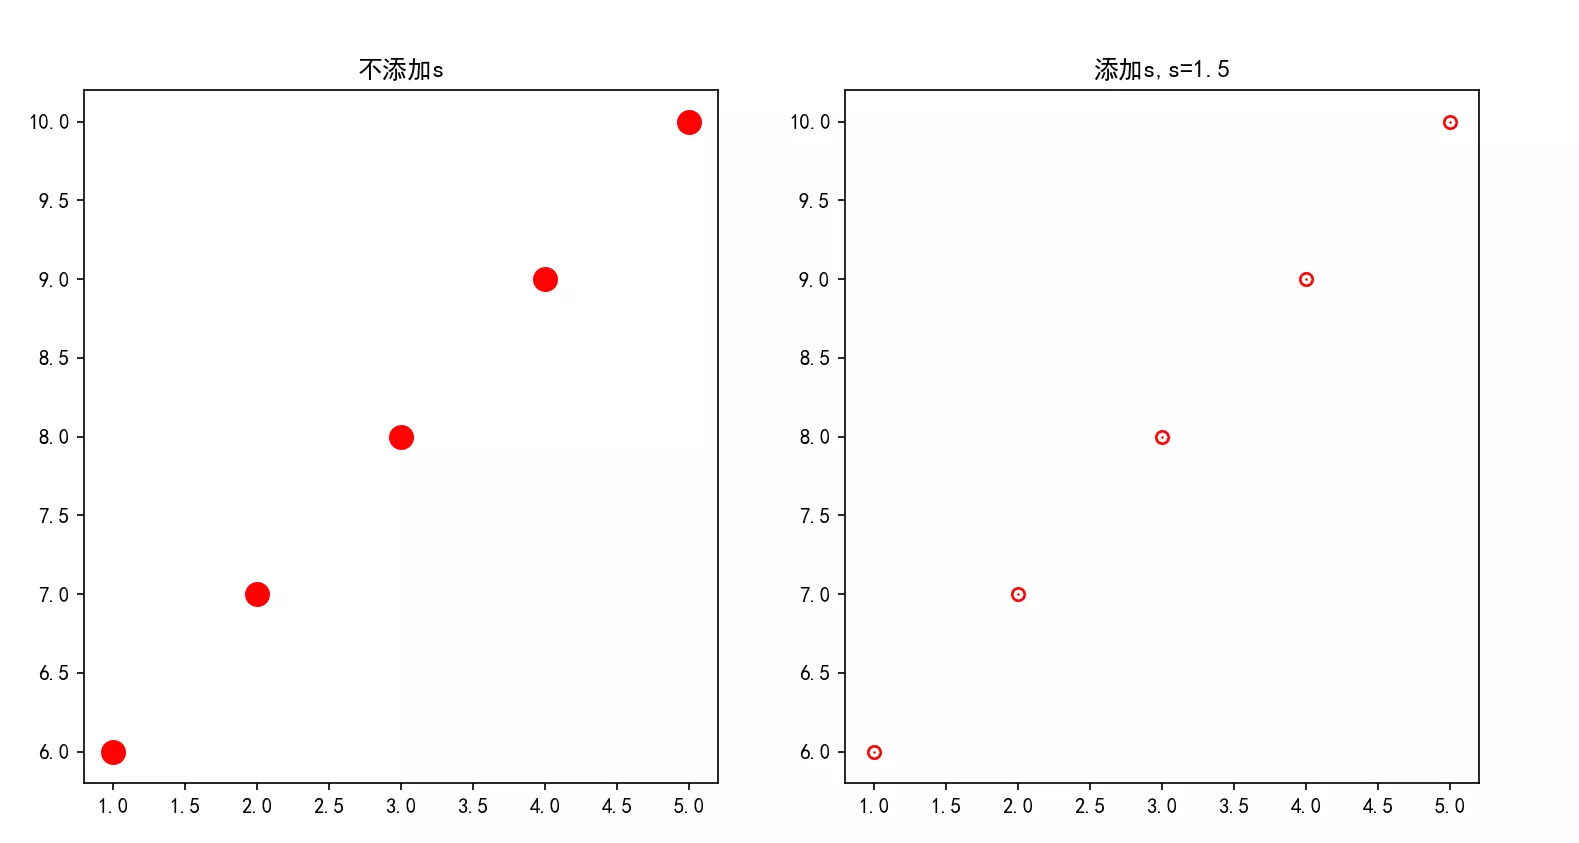
import matplotlib.pyplot as pltplt.figure(figsize=(12,6))plt.rcParams['font.family'] = 'SimHei'a = [1, 2, 3, 4, 5]b = [6, 7, 8, 9, 10]plt.subplot(131)plt.title(' standard ')plt.scatter(a,b,linewidths=6)plt.subplot(132)plt.title(" Set up marker 'x'")plt.scatter(a,b,marker='x')plt.subplot(133)plt.title(" Set up marker 'v'")plt.scatter(a,b,marker='v')plt.show()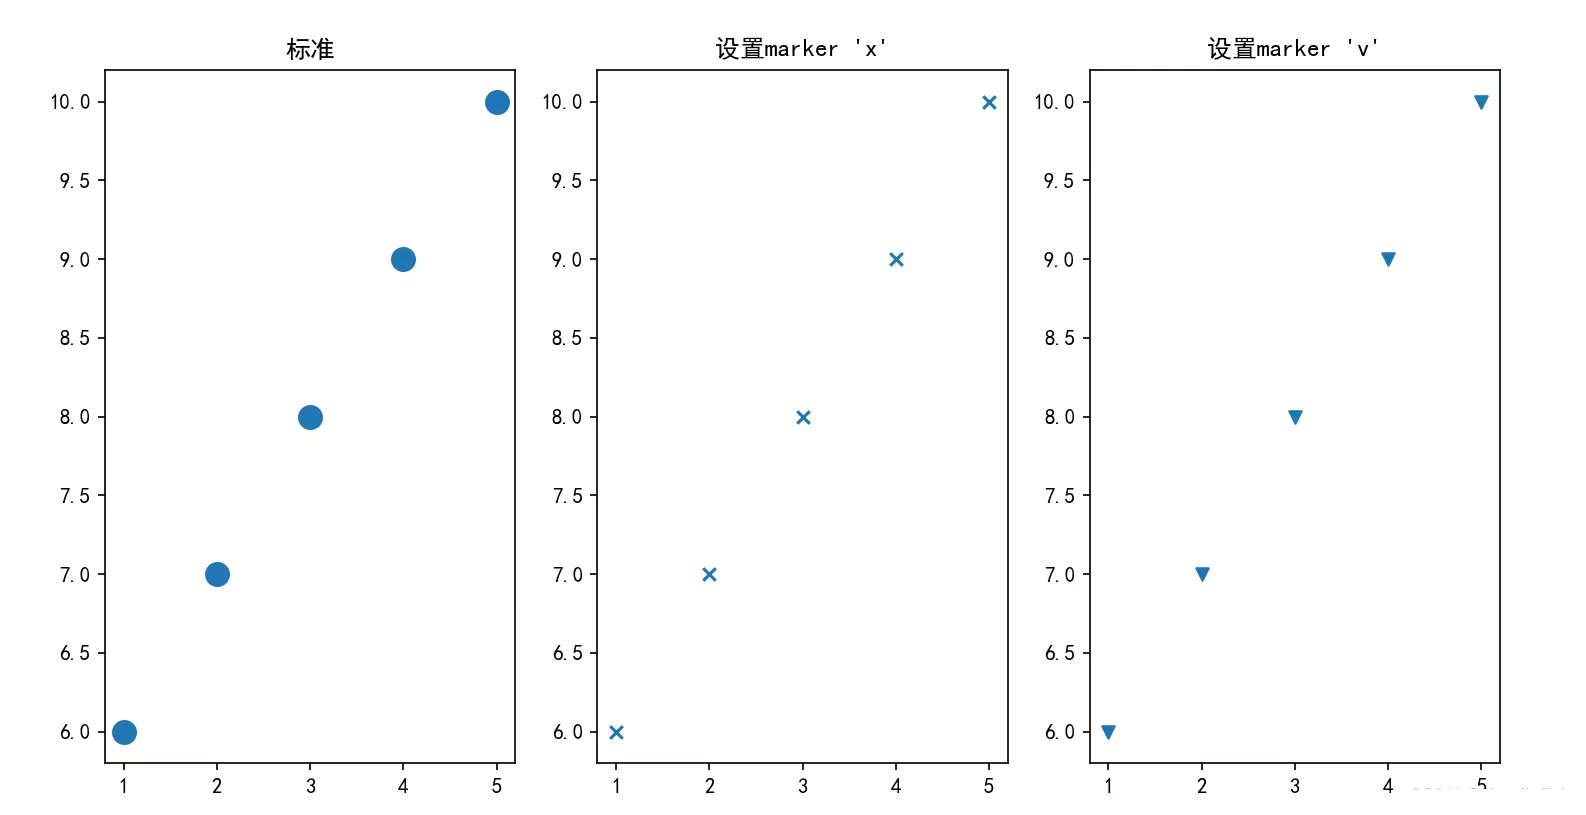

import matplotlib.pyplot as pltplt.figure(figsize=(12,6))plt.rcParams['font.family'] = 'SimHei'a = [1, 2, 3, 4, 5]b = [6, 7, 8, 9, 10]plt.subplot(141)plt.title(" Set up marker '1'")plt.scatter(a,b,s=100,marker='1')plt.subplot(142)plt.title(" Set up marker '2'")plt.scatter(a,b,s=100,marker='2')plt.subplot(143)plt.title(" Set up marker '3'")plt.scatter(a,b,s=100,marker='3')plt.subplot(144)plt.title(" Set up marker '4'")plt.scatter(a,b,s=100,marker='4')plt.show()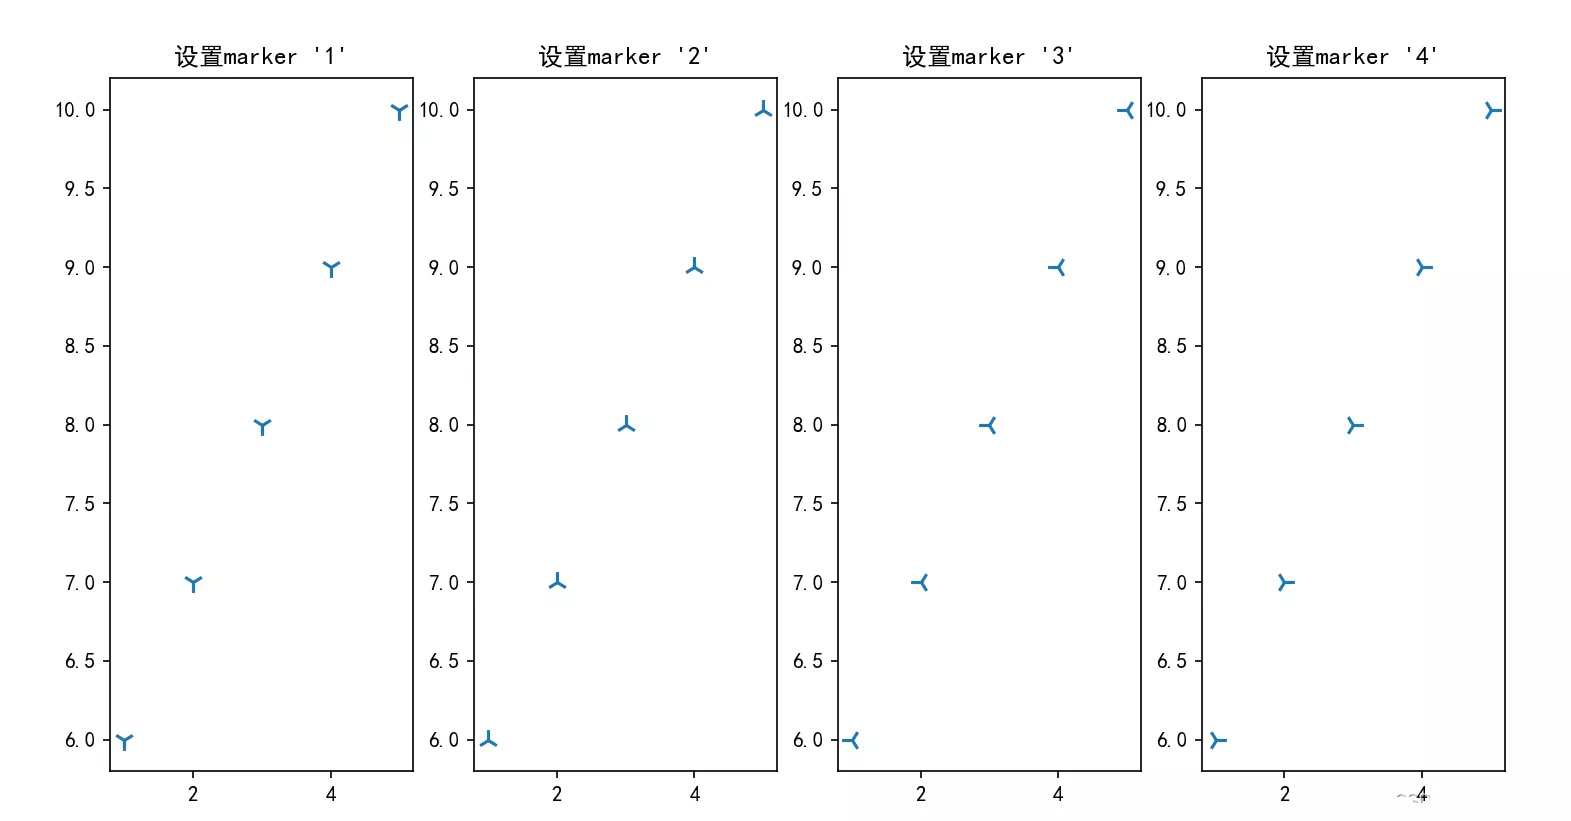
cmap The main thing is to cooperate with c Parameters are used together ,c It can be a color sequence , Use a list of numbers instead of ,plt.cm.Spectral Is a color mapping set , Does not mean that [0:5] Represents a color , Parameters c appear 5 Different values , Then assign a color to each value
import matplotlib.pyplot as plta = [1, 2, 3, 4, 5]b = [6, 7, 8, 9, 10]c = [0, 1, 2, 3, 4]plt.rcParams['font.family'] = 'SimHei'plt.subplot(121)plt.title(' standard ')plt.scatter(a, b, c=c, s=80)plt.subplot(122)plt.title(' add to cmap')plt.scatter(a, b, c=c, s=80, cmap=plt.cm.Spectral)plt.show()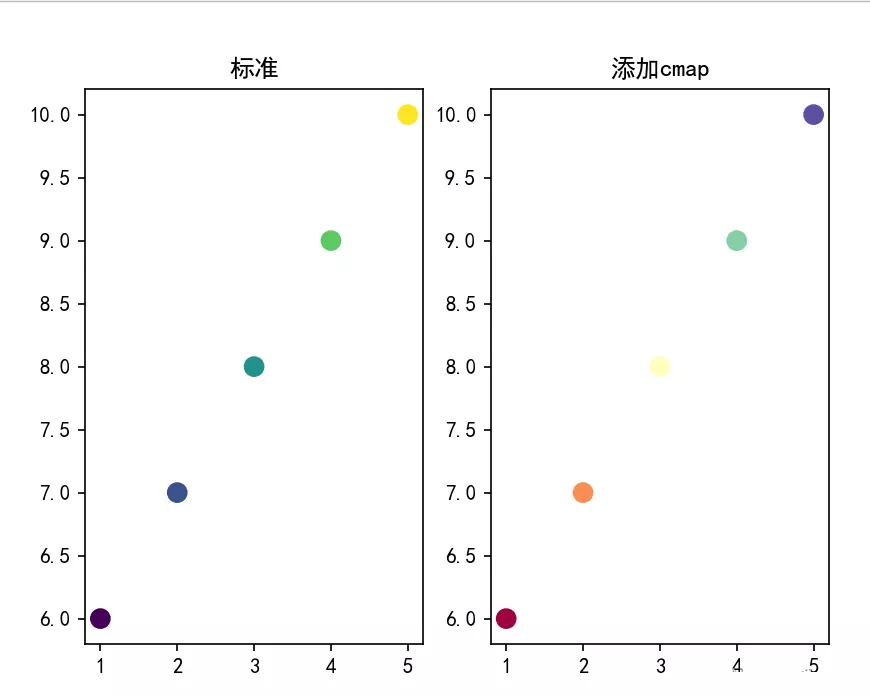
plt.colorbar() Color bar
Multi output setting for scatter chart , It becomes a bubble chart , Let's show :
import matplotlib.pyplot as plt# Import color bar library from matplotlib import colorsimport numpy as npx = np.random.randn(50) # Randomly generated 50 individual X coordinate y = np.random.randn(50) # Randomly generated 50 individual Y coordinate color = np.random.rand(50) # Randomly generate values for mapping colors size = 500 * np.random.rand(50) # The value of randomly changing the size of the scatter changecolor = colors.Normalize(vmin=0.4, vmax=0.8)plt.scatter(x, y, c=color, s = size, alpha=0.3, cmap='viridis', norm=changecolor)plt.colorbar() # Display color bar plt.show()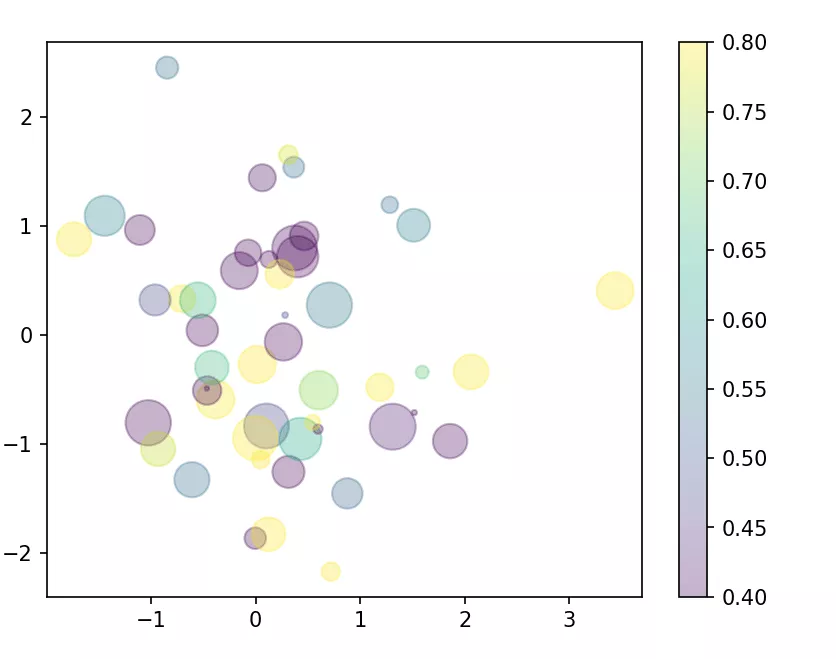
This is about python scatter This is the end of the article on plotting the scatter diagram , More about pyth Please search the previous articles of SDN or continue to browse the related articles below. I hope you will support SDN more in the future !